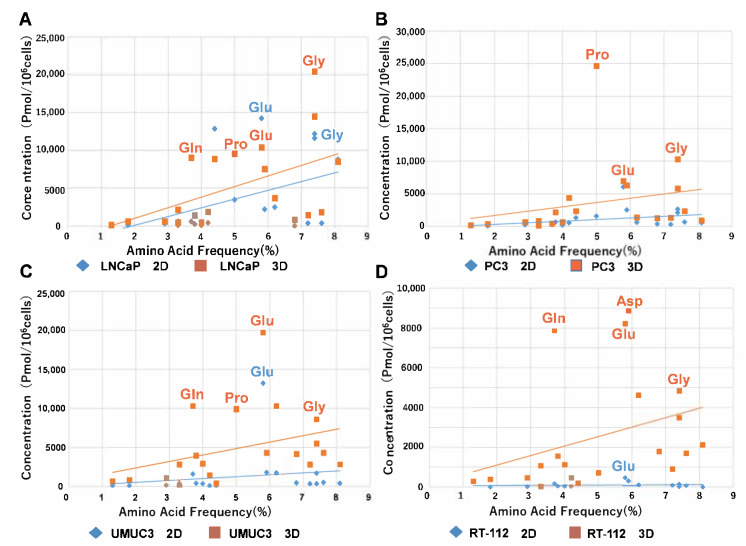
Figure 3.
Comparison of the concentration of free amino acids in each cancer cell between 2D and 3D. (A) LNCaP, (B) PC3, (C) UMUC3, (D) RT-112. The y-axis represents the respective levels of free 20 amino acids in four cell lines in 2D and 3D in the metabolomic analysis. The x-axis represents the average levels of free amino acids in noncancerous mammal cells reported in the previous literature [15]. The slopes of the approximate lines which plotted free amino acids in all cell lines were larger in 3D than in 2D in all cell lines. These findings suggested that cancer cells in 3D produced many more amino acids than those in 2D.

