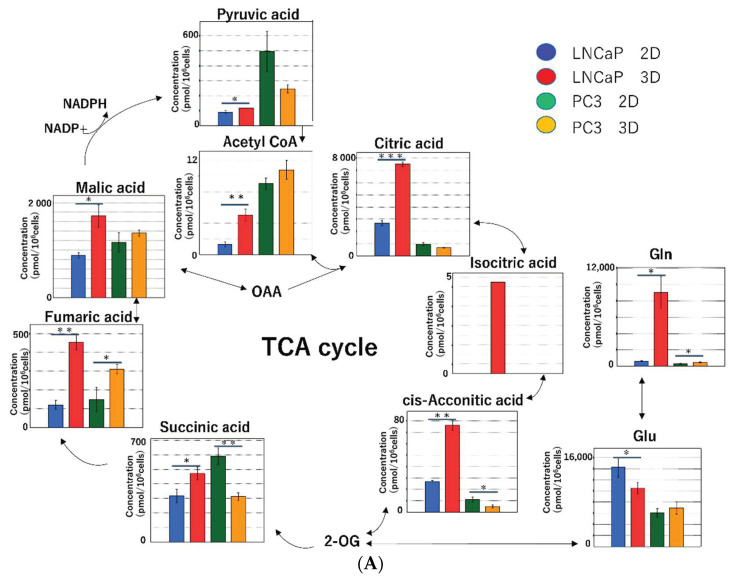
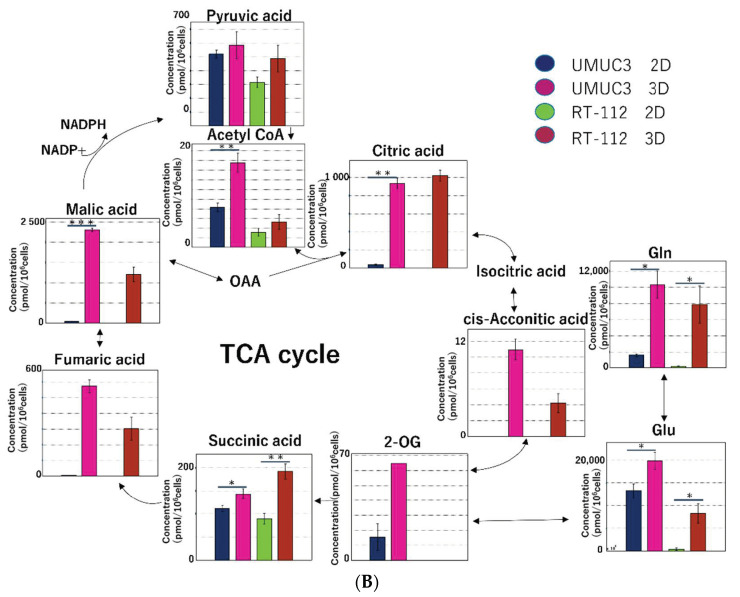
Figure 7.
(A) Metabolomic analysis of the TCA cycle in the prostate cancer cell lines (LNCaP and PC-3). In LNCaP cells, the levels of most metabolites were higher in 3D than in 2D. In PC-3 cells, the levels of pyruvic, succinic and citric acids were higher in 2D than in 3D. (B) Metabolomic analysis of the TCA cycle in the bladder cancer cell lines (UMUC3 and RT-112). In both UMUC3 and RT-112 cells, the levels of metabolites were higher in 3D than in 2D. (* p < 0.05, ** p < 0.01, *** p < 0.001).


