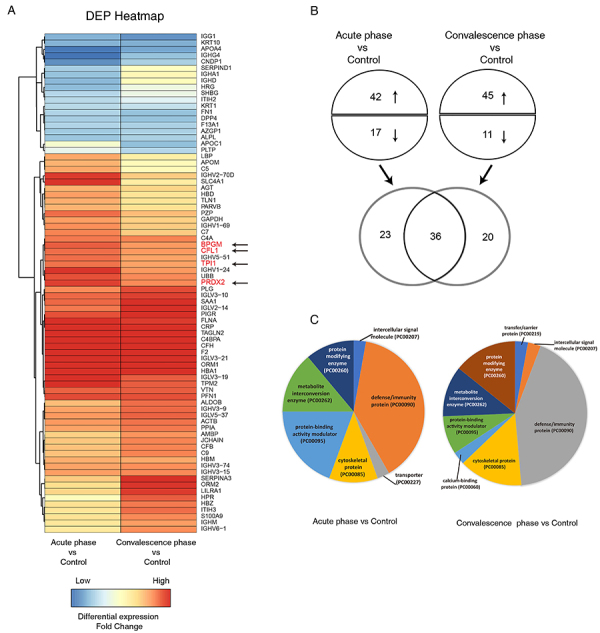
Figure 1. Global profiles, intersection Venn diagram, and protein classification of DEPs between the RSV infection (acute phase and convalescence phase) and control. A, Normalized fold change of DEPs of the acute phase of RSV infection group vs control group (left column) and the convalescence phase of RSV infection group vs control group (right column) is color-coded: red indicates upregulation, and blue indicates downregulation. The arrows indicate the candidate DEPs. B, The number of upregulated (red) and downregulated (blue) DEPs from the acute phase and the convalescence phase. The Venn diagram shows the overlapping DEPs. C, The protein classes of DEPs in the acute phase (left pie chart) and the convalescence phase (right pie chart) are annotated by PANTHER database. DEP: differentially expressed protein; RSV: respiratory syncytial virus.

