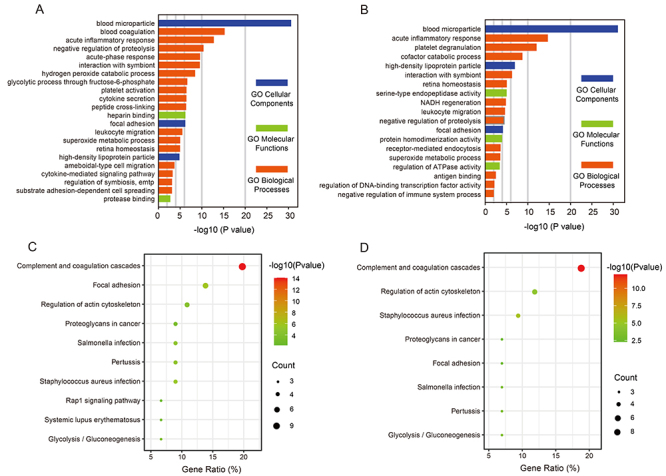
Figure 2. GO and KEGG enrichment analyses of DEPs from acute phase of RSV infection (A, C) and convalescence phase of RSV infection (B, D). A and B, The significantly enriched GO terms (P<0.05) are shown in a negative log10 scale of P values. C and D, Scatter plot of enriched KEGG pathways (P<0.05) for DEPs. Color and size of dots represent probability of the adjusted P value and the number of matched DEPs, respectively. The X-axis represents the proportion of DEPs in each pathway category. DEPs: differentially expressed proteins; RSV: respiratory syncytial virus; GO: gene ontology; KEGG: Kyoto Encyclopedia of Genes and Genomes.

