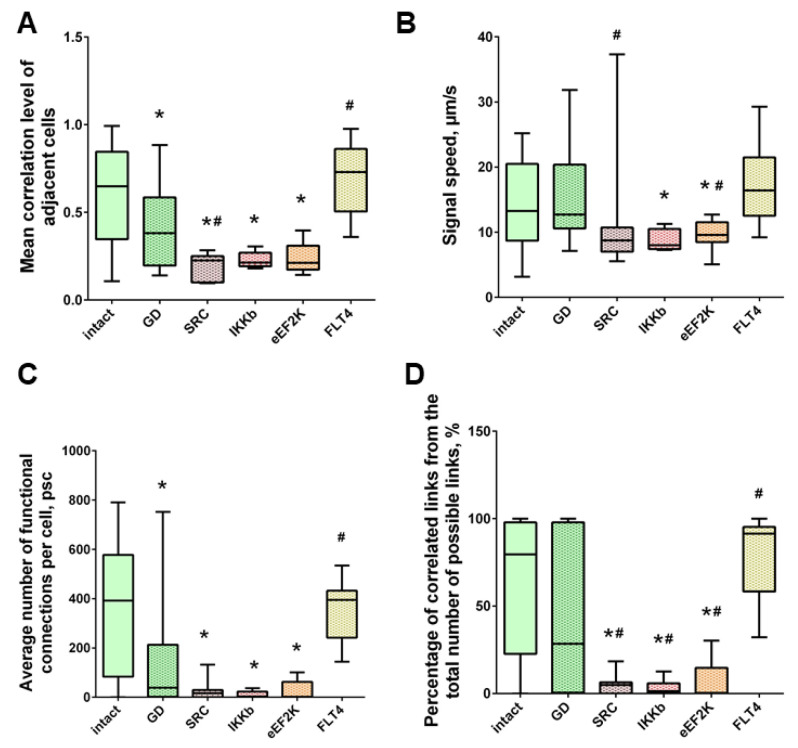
Figure 7.
Neuron-glial network activity reorganization in primary hippocampal cultures. (A) Mean correlation level of adjacent cells; (B) the rate of signal delay between cells; (C) average number of functional connections per cell; (D) the percentage of correlated connections from the total number of possible connections. * versus “Intact”, # versus “GD”, p < 0.05, the Mann-Whitney test.

