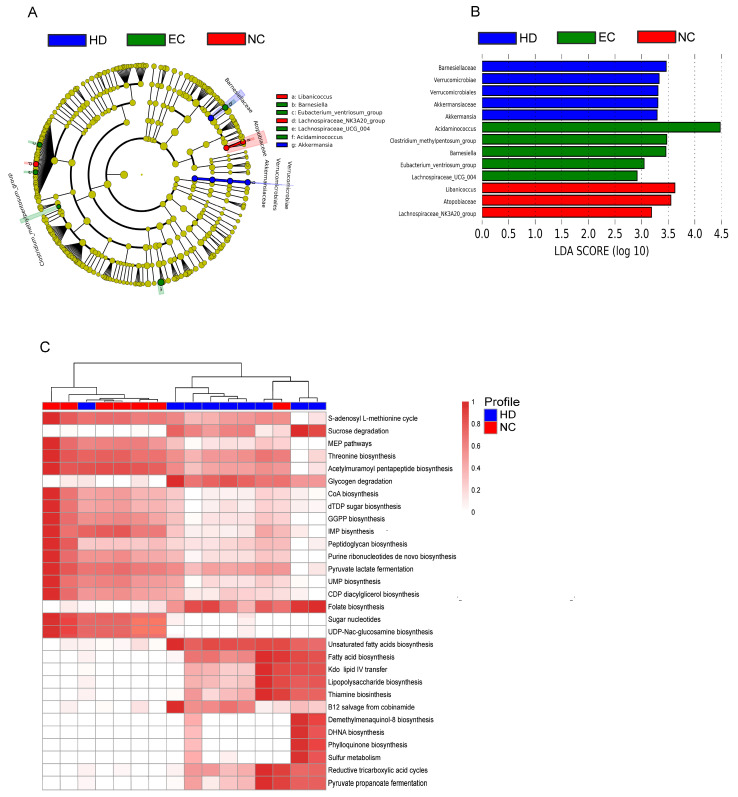
Figure 2.
Taxonomic differences and inferred functional content of gut microbiota of healthy donors (HD), elite controllers (EC), and non-controllers (NC). LefSe results for the bacterial taxa that were significantly different between HD, EC, and NC groups. The cladogram showing differentially abundant taxonomic clades (A) and LDA scores showing significant differences between groups (B). Comparison of PICRUSt predicted KEGG function. The heatmap shows the relative abundance of pathways that were significantly different between HD and NC groups (C). Significant differences between groups were tested with Mann–Whitney test (FDR-adjusted p-value < 0.05).

