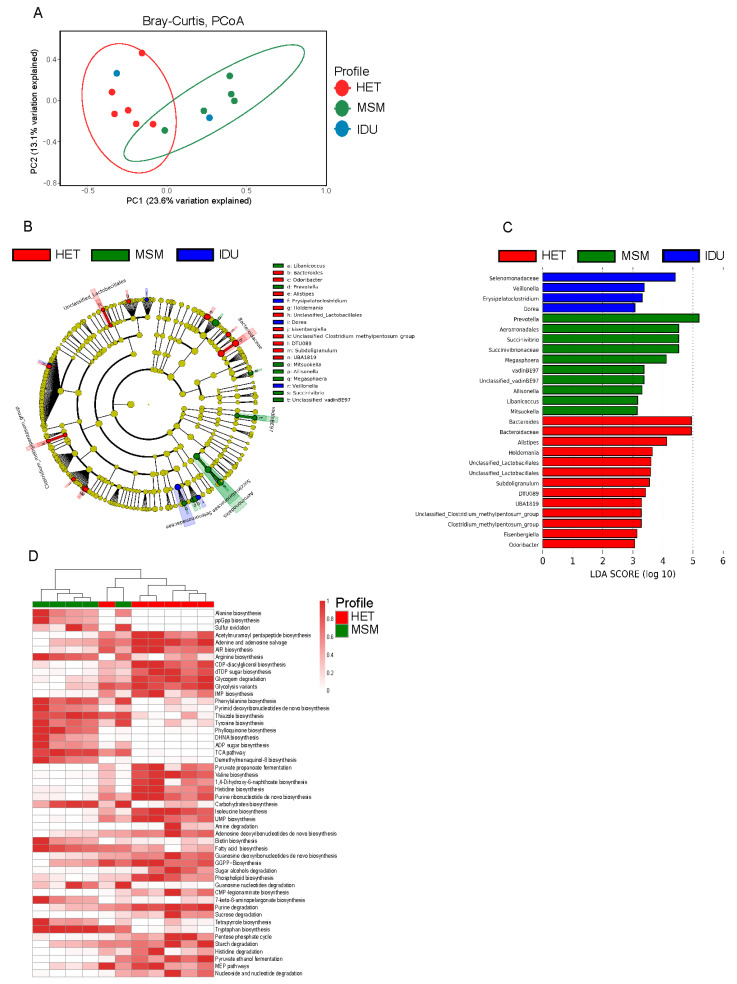
Figure 3.
Effects of HIV transmission route on the gut microbiota of HIV-1 positive patients. Principal Coordinate Analysis (PCoA) of Bray Curtis distances among HET, MSM, and IDU groups (A). LEfSe results for the bacterial taxa that were significantly different between HET, MSM, and IDU groups. The cladogram shows differentially abundant taxonomic clades (B), and LDA scores showing significant differences between groups (C). Heatmap of relative abundance pathways that were significantly different between HET and MSM groups (D). Significant differences between the two groups were tested with Mann–Whitney test (FDR-adjusted p-value < 0.05).

