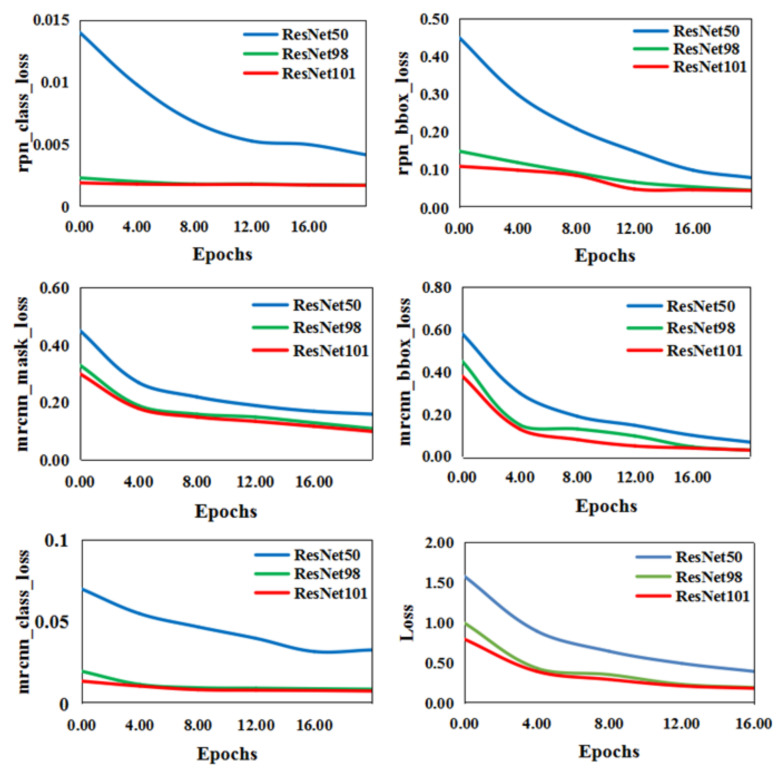
Figure 10.
The convergence curves of the six loss functions with different numbers of layers. (ResNet50, ResNet98, and ResNet101 represent the number of layers being 50, 98, and 101, respectively. The blue, green, and red lines correspond to convergence of the loss function when the number of ResNet network layers is 50, 98, and 101, respectively.)

