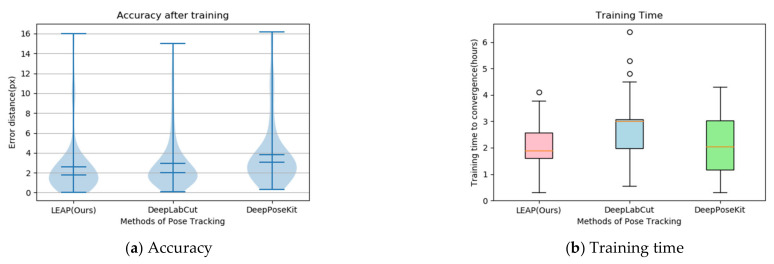
Figure 12.
Accuracy and training time for the three models tracking joint points: (a) violin plots denote the overall error distribution, and the error bars denote the 25th and 75th percentiles; (b) the red, blue, and green boxes plot the training times of LEAP (Leap Estimate Animal Pose), DeepLabCut, and DeepPoseKit, respectively.

