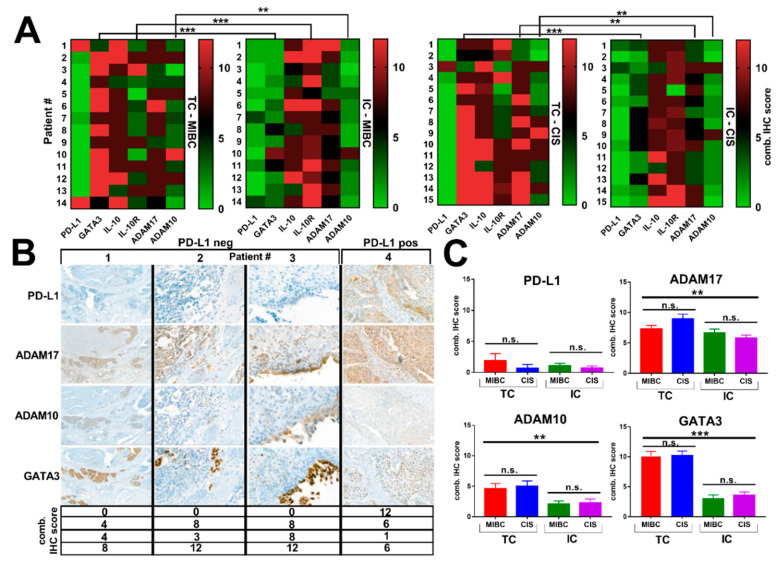
Figure 3.
(A) Heat mapping with continuous green-black-red shading. Heat maps from individual patients (labeled 1 to 14 or 1 to 15) are arranged from top to bottom left based on increasing IHC combined score (0–12) of PD-L1, GATA3, IL-10, IL-10R, ADAM17, and ADAM10. Barlines show the direct comparison between TC and IC within MIBC and CIS. * p < 0.05; ** p < 0.01; *** p < 0.001 according to Mann–Whitney U test. (B) Representative IHC images of PD-L1, ADAM17, ADAM10, and GATA3 within MIBC for four selected patients, presenting three patients with PD-L1 negative status (#1–3, pure urothelial carcinoma, comb. score of 0 in all patients) and one patient (#4) with positive PD-L1 expression (combined score of 12, urothelial carcinoma with squamous differentiation). Final histology at RC specimens confirmed pT3b + CIS N0R0 (patient #1), pT3a N2R0 (patient #2), pT1 HG + CIS N0R0 (patient #3), and pT3b N1R0 (patient #4). Irrespective of PD-L1 status, patients display GATA3 and simultaneous ADAM17 expression. (C) Mean IHC combined scores for PD-L1, ADAM17, ADAM10, and GATA3 assessed for both tumor regions (MIBC and CIS) and both cell types (TC and IC) are shown. Statistically significant differences of expression patterns were confirmed for GATA3, ADAM17, and ADAM10. Data represent mean ± SEM (* p < 0.05; ** p < 0.01; *** p < 0.001 according to independent samples Kruskal–Wallis test and Mann–Whitney U test).

