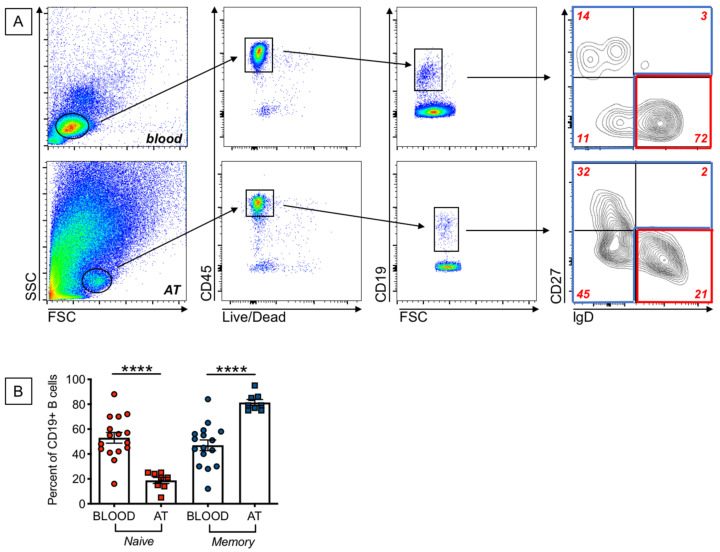
Figure 2.
Increased frequencies of memory B cells, and decreased frequencies of naïve B cells, in the AT, as compared to the peripheral blood, of individuals with obesity. (A). Gating strategies and a representative dot plot from PBMC (top) and SVF (bottom) to show naïve and memory B cell subsets. (B). Frequencies of naïve and the memory B cell subsets that include IgM memory, switched memory and DN memory B cells. Mean comparisons between groups were performed by Student’s t test (two-tailed). **** p < 0.0001.

