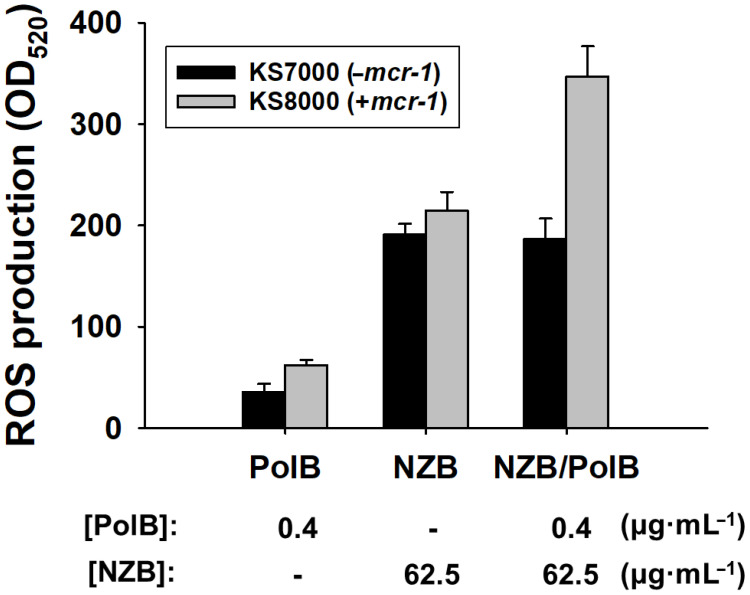
Figure 5.
Quantification of ROS production. Fluorescence intensities at 520 nm for E. coli KS7000 (−mcr-1) and KS8000 (+mcr-1) cells treated with PolB, NZB, and NZB/PolB, respectively, were measured. Bacterial cell suspension in PBS without NP treatment was used as a blank. MARS Data Analysis software (ver. 3.02 R2; BMG Labtech GmbH, Ortenber, Germany) was used for data processing and averaged values of relative ROS production by NPs from triplicate experiments were shown (p < 0.05).

