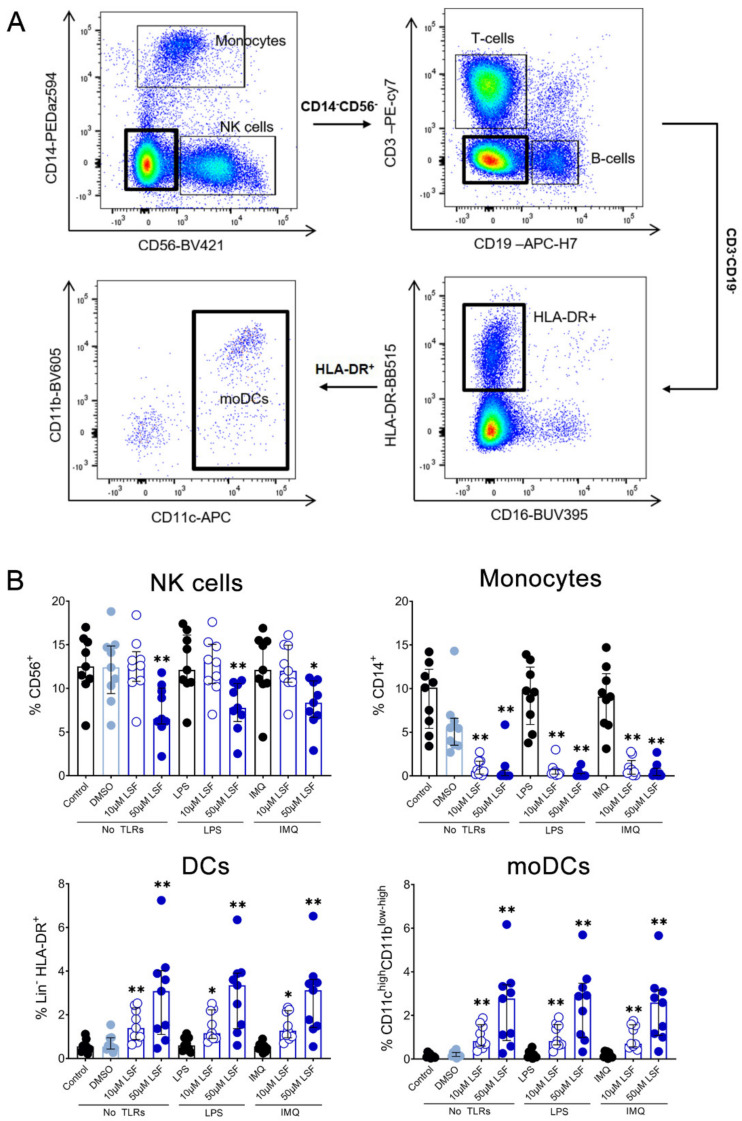
Figure 3.
The effect of LSF on innate immune cell populations. Gating strategy (A) and flow cytometric results (n = 9) are displayed as a proportion of total lymphocyte populations (B). The median ± IQR is displayed. The medium control was used as the control group for comparisons with the TLR-stimulated groups; the DMSO control was used as the vehicle control for comparison with the LSF treatments. * p < 0.05, ** p < 0.01 compared to the respective untreated control using a non-parametric Wilcoxon signed-rank test. Legend: • Control/LPS/IMQ,  10 µM LSF, • 50 µM LSF, • DMSO. Abbreviation: CD, cluster of differentiation; DC, dendritic cell, DMSO, dimethyl sulfoxide; HLA-DR, Human Leukocyte Antigen–DR isotype; IMQ, imiquimod; IQR, inter-quartile range; Lin, lineage; LPS, lipopolysaccharide; LSF, L-sulforaphane; moDC, monocyte-derived dendritic cell; NK, natural killer cell; TLR, toll-like receptor.

