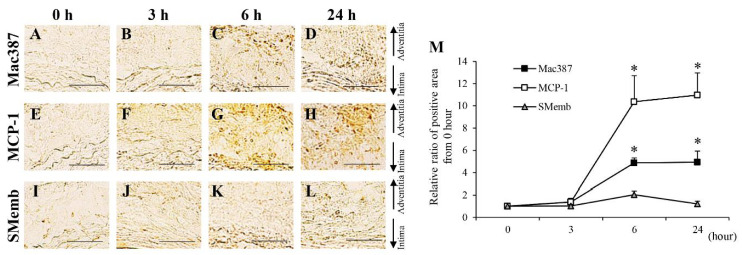
Figure 4.
Time-dependent changes of mac387+ macrophage, monocyte chemoattractant protein-1 (MCP-1) and synthetic vascular smooth muscle (SMemb) from 0 to 24 h. (A–D) Representative images of the immunostaining for mac387 (scale bar = 50 µm). (E–H) Representative images of the immunostaining for MCP-1 (scale bar = 50 µm). (J–L) Representative images of the immunostaining for SMemb (scale bar = 50 µm). (M) Quantification of the relative ratio from 0 h of the areas positive for mac387, MCP-1, and SMemb in the vascular wall. Data are expressed as the mean ± SEM. * P < 0.05 versus 0 h. Mac387: 0 h (n = 5), 3 h (n = 6), 6 h (n = 5), and 24 h (n = 5), MCP-1: 0 h (n = 6), 3 h (n = 5), 6 h (n = 6), and 24 h (n = 6), and SMemb: 0 h (n = 6), 3 h (n = 6), 6 h (n = 6), and 24 h (n = 6).

