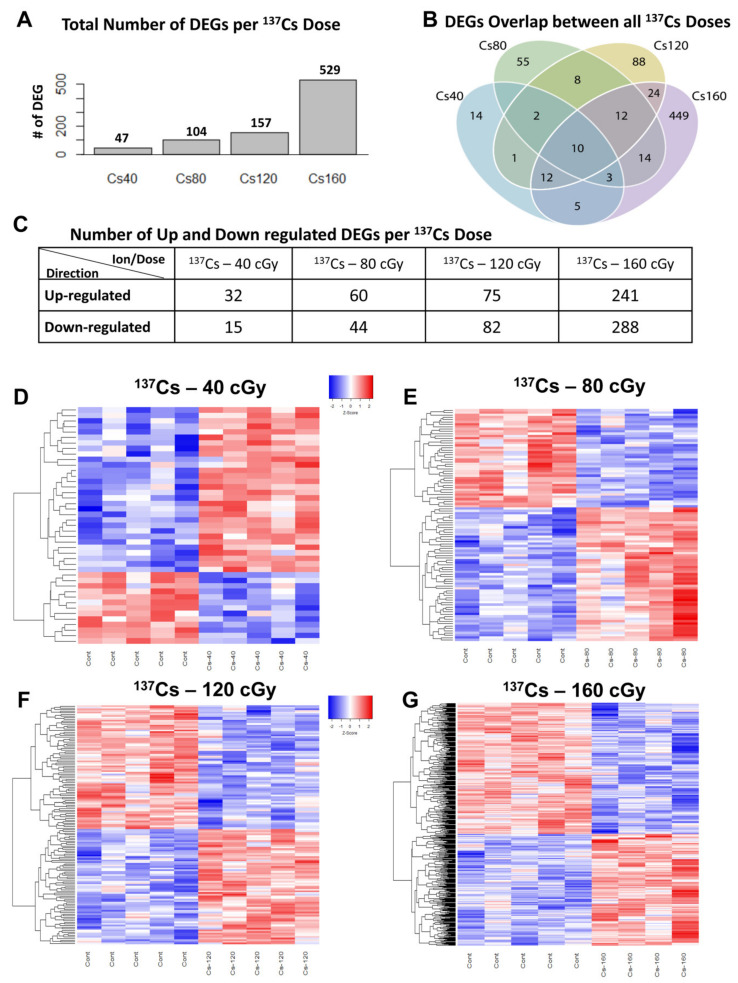
Figure 1.
Different gene expression in mouse heart tissue following 137Cs-gamma irradiation: (A) bar graphs showing differentially expressed genes in the mouse heart tissue at different 137Cs (Cs, cesium) doses and (B) Venn diagram depicting the number of differentially expressed genes in the mouse hearts across different doses of 137Cs irradiation. Colors in the diagram represent genes putatively affected by the following 137Cs dose exposure: blue circles correspond to 40 cGy, green circles to 80 cGy, yellow circles to 120 cGy, and purple circles to 160 cGy. (C) Table depicting the number of up- and downregulated genes at different 137Cs-IR doses in the heart tissue and (D–G) heat maps showing differentially expressed genes at different 137Cs-IR doses. Relative expression values are indicated on the color key and increase in value from blue to red (n = 5/group).

