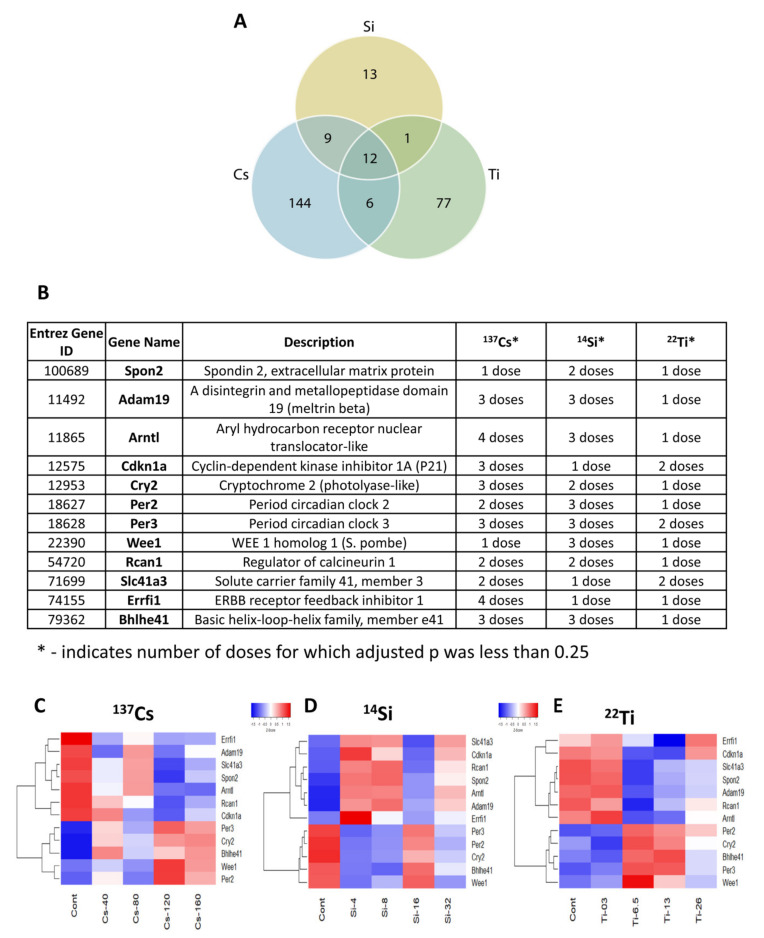
Figure 4.
Overlapping differentially expressed genes: (A) Venn diagram depicting the overlap of enrichment terms amongst three different radiation exposure groups (137Cs, 14Si, and 22Ti) compared to the control group. In the diagram, blue circles represent genes putatively affected by long-term 137Cs exposure, yellow circles represent genes influenced by 14Si exposure, and green circles represent those affected by 22Ti exposure. (B) Table depicting 12 commonly expressed genes in one or more of all radiation-type exposures and (C–E) microarray data analysis showing heat maps of the 12 overlapping commonly expressed genes in different radiation groups/doses. Relative expression values are indicated on the color key and increase in value from blue to red (n = 5/group).

