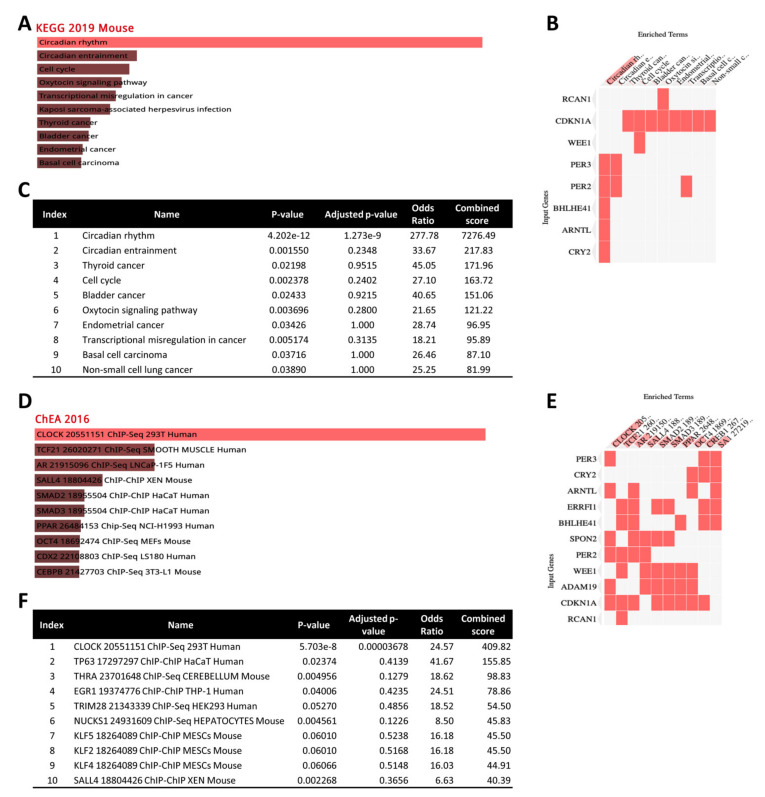
Figure 6.
A comprehensive gene set enrichment analysis for the 12 common genes differentially regulated across all 3 radiation groups was performed using EnrichR and the Kyoto Encyclopedia of Genes and Genomes (KEGG) 2019 Mouse database and ChIP-X enrichment analysis (ChEA) gene set library. (A) Bar graphs (sorted by p-value ranking) represent the significance of that specific gene set using the KEGG 2019 Mouse database. The brighter the color, the more significant that term. (B) The clustergrammer is sorted by combined scores (p-value and z-score) and shows heatmaps. Enriched terms are shown as columns and input genes as rows to understand the relationships between input genes and enriched terms. Cells in the matrix indicate whether a gene is associated with the indicated term. (C) The table shows a raw view of the data and is sorted by p-value. Terms, z-score, odds ratio, and combined score are indicated. (D) Bar graphs (sorted by p-value ranking) represent the significance of identified upstream transcription factors using the ChEA 2016 gene set library. The brighter the color, the more significant the transcription factor (TF). (E) The clustergrammer is sorted by p-value and shows heatmaps of enriched terms as columns. Input genes are shown as rows to understand the relationships between the input genes and enriched TFs. Cells in the matrix indicate whether a gene is associated with the predicted TF. (F) The table shows a raw view of the data and is sorted by p-value. Terms, z-score, odds ratio, and combined score are indicated.

