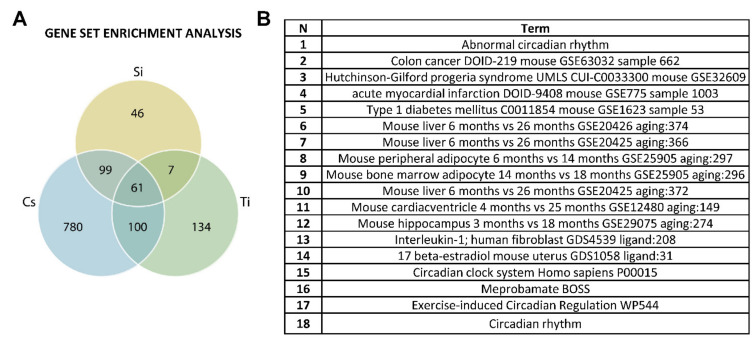
Figure 7.
Overlapping biological processes: (A) Venn diagram analysis of differentially expressed genes across all three different radiation exposure groups/doses compared to controls. In each paired test, the differentially expressed genes were identified as a log2 fold change and p < 0.05. In the diagram, blue circles represent genes putatively affected by long-term 137Cs exposure, green circles represent genes influenced by 14Si exposure, and yellow circles represent genes that were putatively affected by 22Ti exposure. (B) The table represents various biological processes that are common for all three radiation groups.

