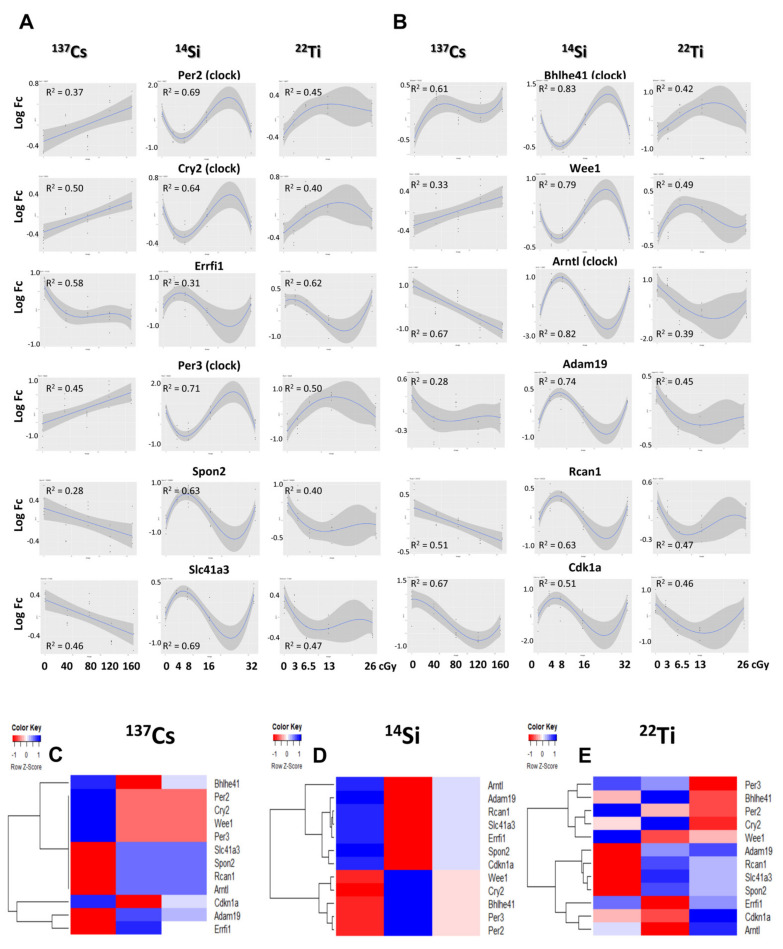
Figure 8.
Dose–response analyses of expression of 12 genes commonly deregulated in all three radiation conditions: (A,B) expression profile–exposure dosage analysis indicates that 137Cs irradiation mostly causes linear changes in gene expression, while irradiation with 14Si and 22Ti mainly induces a non-linear gene expression response. (C–E) Heatmap clustering of non-linear regression fit coefficients for 12 common genes in 137Cs-, 14Si-, and 22Ti-IR groups, respectively. The columns in heatmaps represent non-linear fit coefficients.

