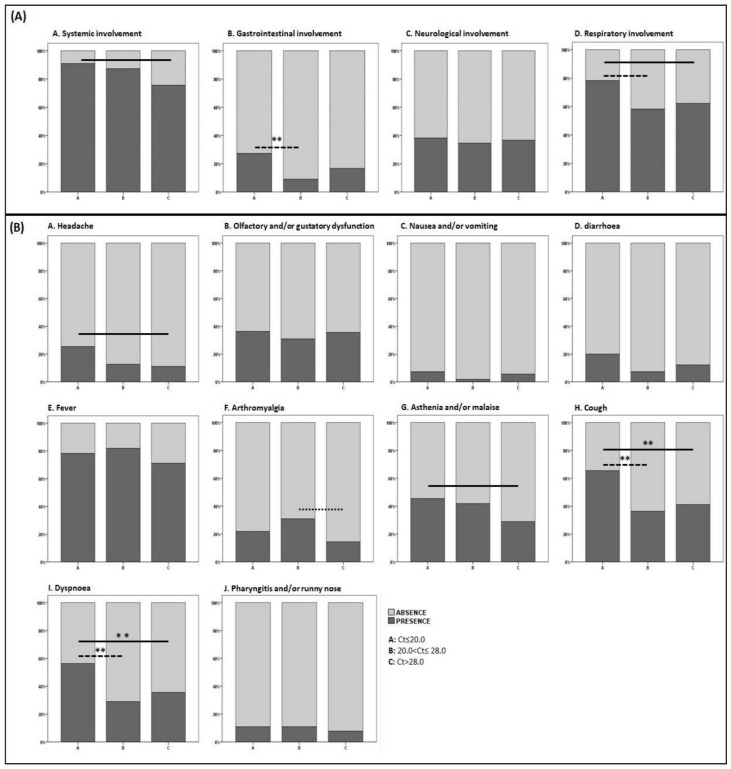
Figure 1.
Signs and symptoms of COVID-19 at diagnosis, individual and pooled for main categories according to SARS-CoV-2 Cycle threshold. Only significant differences (Mann–Whitney) are shown as bars in the figure. Pooled signs and symptoms. (Panel A) (A) Group A 50 (90.9%) vs. Group C 68 (75.5%), p = 0.022; (B) Group A 15 (27.3%) vs. Group B 5 (9.1%), p = 0.014 **; (D) Group A 43 (78.2%) vs. Group B 32 (58.2%), p = 0.025 and Group A 43 (78.2%) vs. Group C 56 (62.2%), p = 0.046. Individual signs and symptoms. (Panel B) (A) Group A 14 (25.4%) vs. Group C 10 (11.1%), p = 0.025; (F) Group B 17 (30.9%) vs. Group C 13 (14.4%), p = 0.018; (G) Group A 25 (45.4%) vs. Group C 26 (28.9%), p = 0.043; (H) Group A 36 (65.4%) vs. Group B 20 (36.4%), p = 0.002 ** and vs. Group C 37 (41.1%), p < 0.005 **; (I) Group A 31 (56.4%) vs. Group B 16 (29.1%), p = 0.004 ** and vs. Group C 32 (35.6%), p = 0.015 **. After Bonferroni correction significance was deemed retained by those comparisons with a p-value <0.016 only (highlighted by **).

