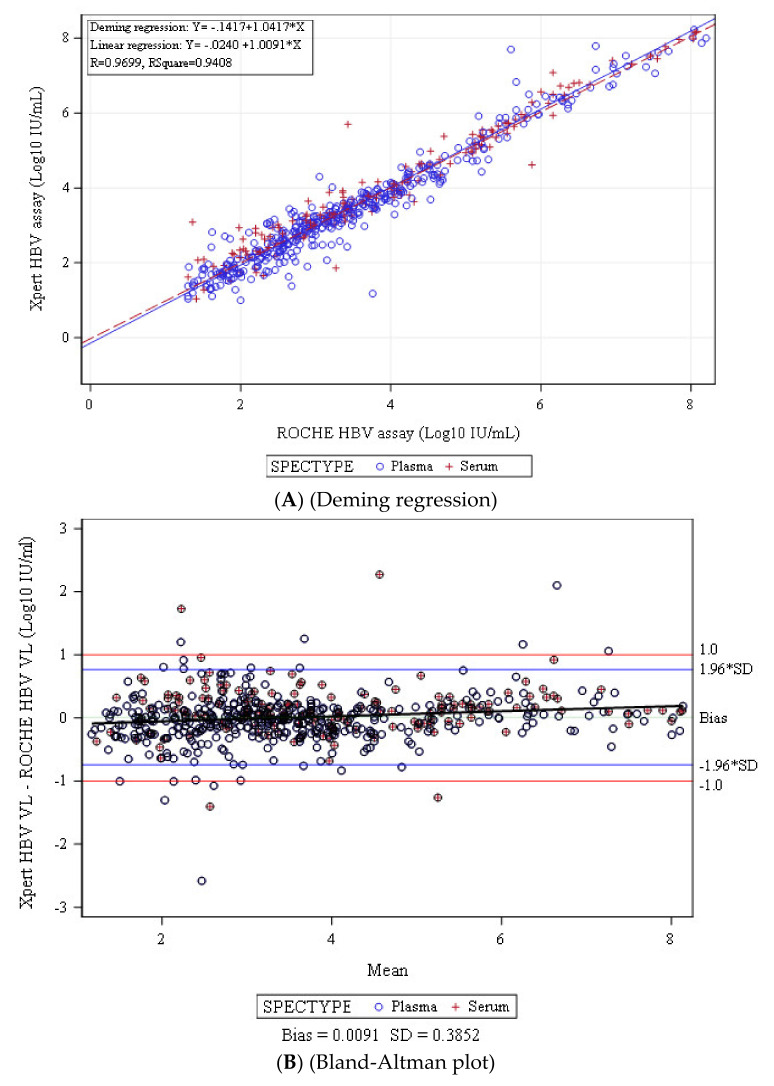
Figure 1.
Deming correlation and Bland–Altman-plot analysis of HBV DNA levels measured by Xpert HBV Viral Load and CAP/CTM HBV version 2.0 assays. (A) Deming regression of 560 clinical specimens quantified by both assays. (B) Bland–Altman plot analysis of 560 samples quantified by both assays. The dotted and dashed lines represent mean differences ± 1.96 SD, respectively.

