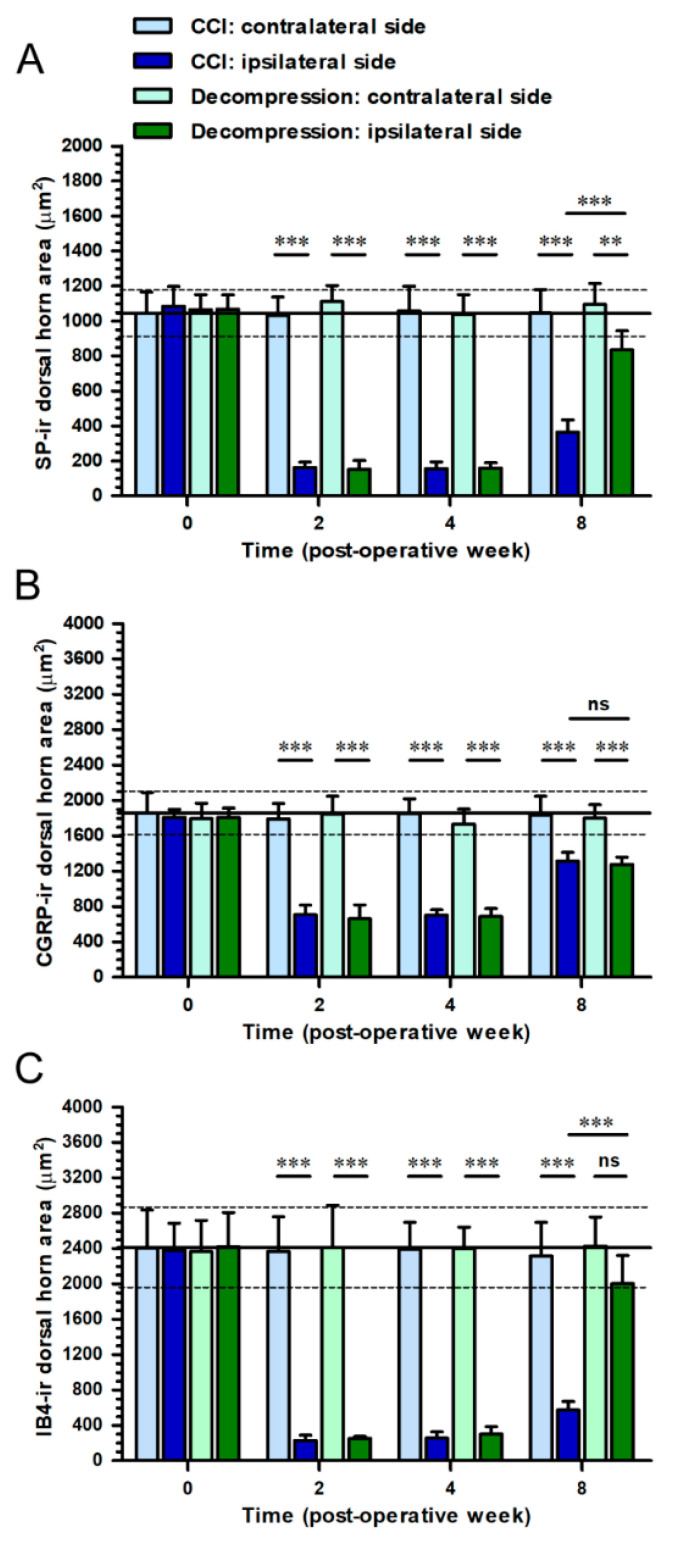
Figure 5.
Quantitation of CCI-induced changes of peptidergic and non-peptidergic nerve terminals in dorsal horn after nerve decompression. In (A,B,C) CCI group (dark blue bars) and Decompression group (dark green bars), panels illustrated the temporal changes of (A) SP-, (B) CGRP- and (C) IB4-ir expressions on ipsilateral sides, which were quantified as the dorsal horn area (μm2) in the medial portion of dorsal horn. The values on contralateral sides in CCI group (light blue bars) and Decompression group (light green bars) were also shown in panels for comparison. All the values were expressed as mean ± SD (n = 5 per time points). Student’s t test was applied to examine contralateral side vs. ipsilateral side and CCI group vs. Decompression group at each time points. ** p < 0.01 and *** p < 0.001, indicated a significant difference and ns mean no significant difference.

