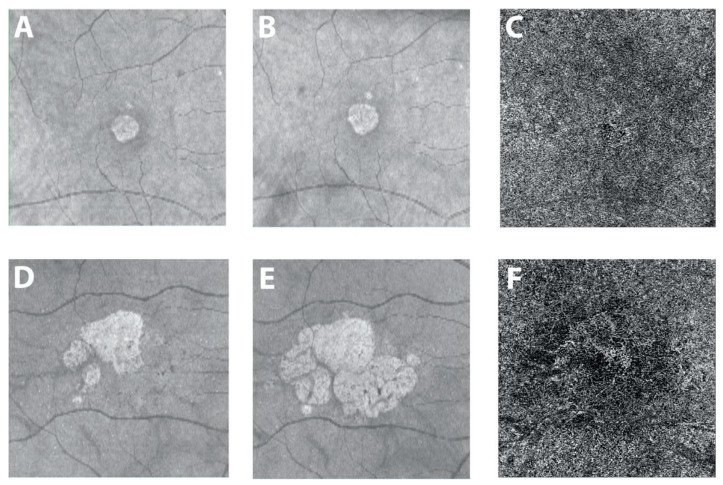
Figure 1.
Courtesy of Nassisi et al. 2019: Geographic atrophy and different growth rates: One eye from two patients with geographic atrophy (GA) is shown in the two rows of images. (A,D) En face structural optical coherence tomography (OCT) images at baseline. (B,E) En face OCT images acquired one year later. The 2 patients show a very different yearly growth rate (0.07 and 0.73 for the first and second row, respectively) of the atrophic lesins. The corresponding OCT angiogram at the level of the choriocapillaris (C,F) from the baseline visit for these two patients shows dramatically different flow impairment surrounding the atrophic lesion, with significantly greater flow voids in the case with more rapid progression of atrophy (41.2% versus 53% for (C,F) respectively) [73].

