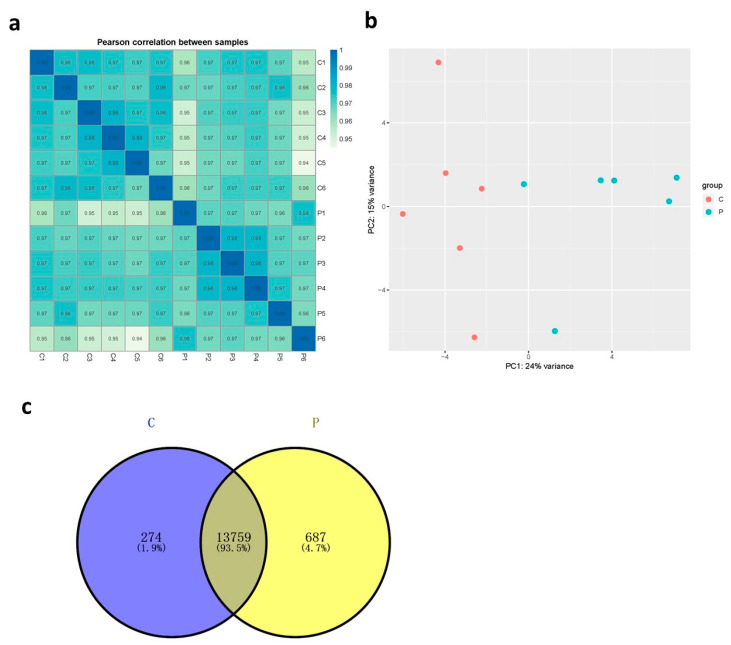
Figure 1.
Transcriptome profiles of ileal tissues from 21-day-old broilers. (a) Correlation coefficient heat map between individual samples. The value is the square of the correlation coefficient of Pearson (R2) (p < 0.01). (b) Principal component analysis of transcriptomes from control group and probiotics group. (c) Venn diagram of the number of expressed genes detected in control group and probiotics group. “P” = Bacillus amyloliquefaciens TL group; “C” = control group.

