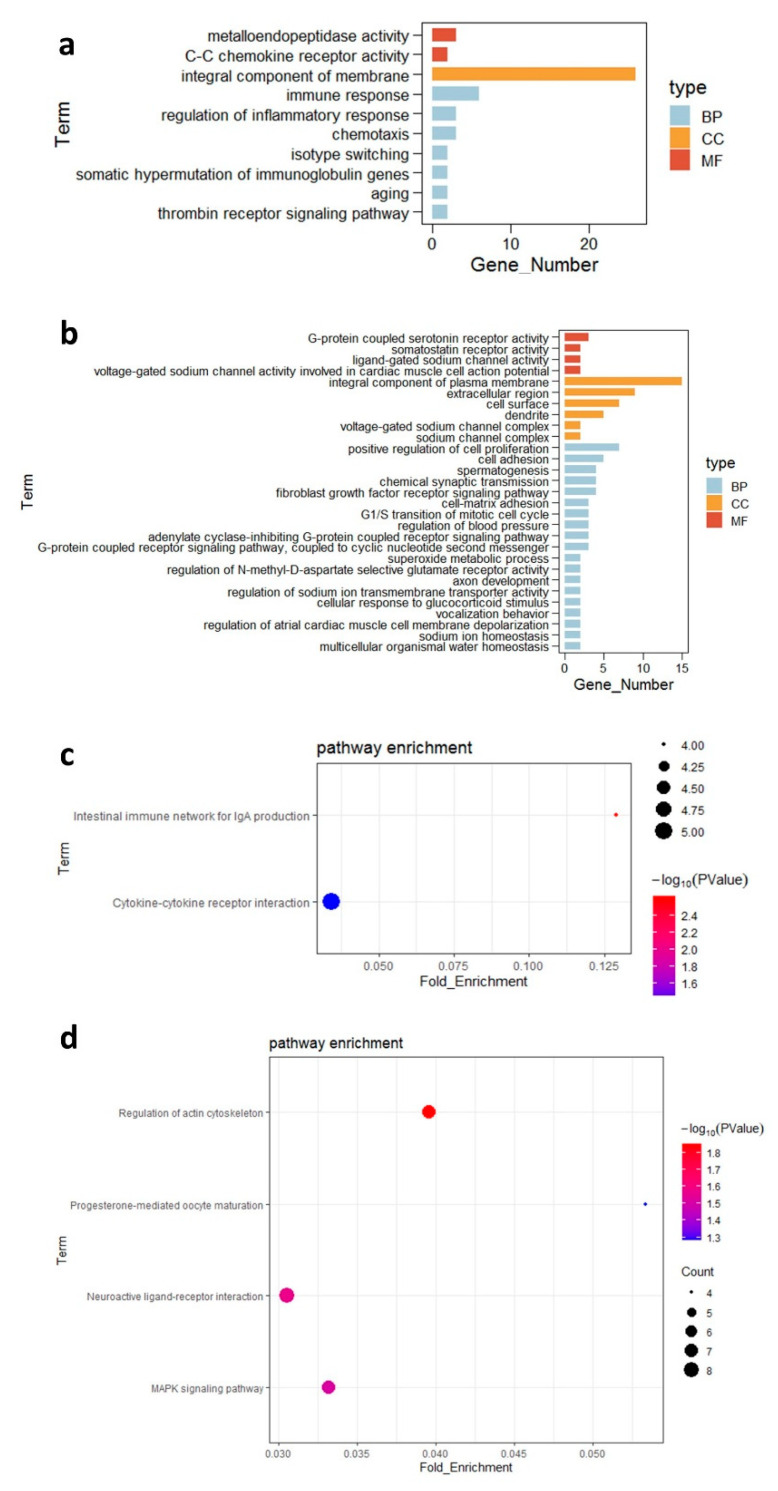
Figure 3.
Functional enrichment analysis of uniquely expressed genes (a) Gene ontology (GO) enrichment analysis of the uniquely expressed genes scattered in the C group. (b) GO enrichment analysis of the uniquely expressed genes scattered in the P group. (c) Enriched Kyoto Encyclopedia of Genes and Genomes (KEGG) pathways of differentially expressed genes (DEGs) in the C group. (d) Enriched KEGG pathways of DEGs in the P group. “BP” = biological process, “CC” = cellular component, “MF” = molecular function, “C” = control group, and “P” = Bacillus amyloliquefaciens TL group.

