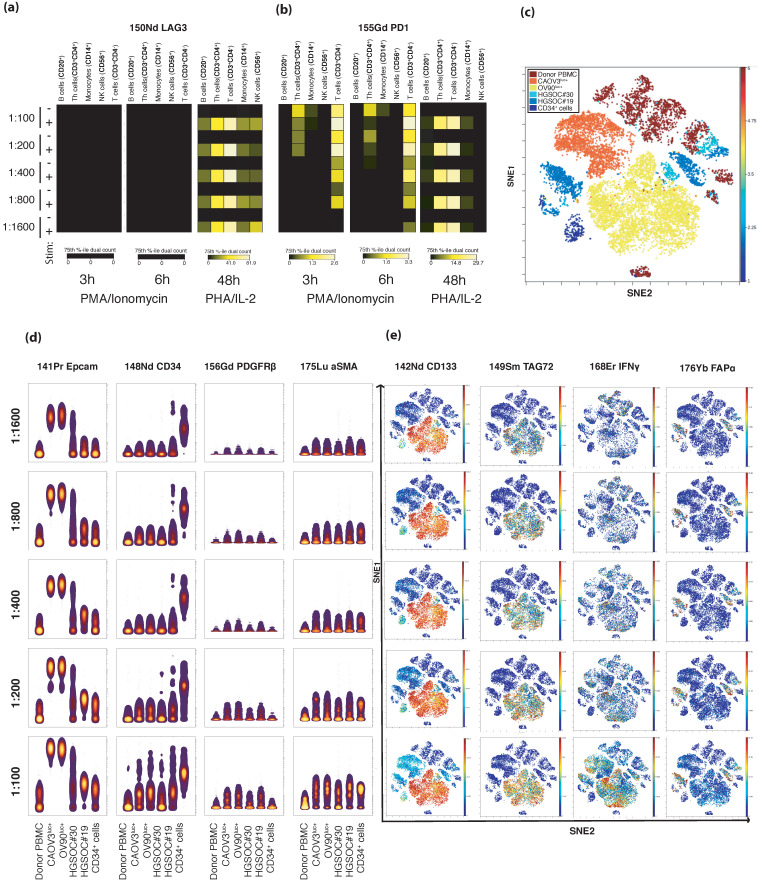
Figure 1.
Titration of the panel antibodies using Cytobank software. (a,b) Immune checkpoint antibodies were titrated on both peripheral blood mononuclear cells (PBMCs) stimulated by phorbol 12-myristate 13-acetate (PMA) (25 ng/mL) + ionomycin (1 μg/mL) and PBMCs stimulated by phytohemagglutinin (PHA) (2.5 μg/mL) + interleukin 2 (IL-2). Heatmaps show that LAG-3 (a) was only expressed after stimulation by PHA/IL-2 and that PD-1 expression (b) differed with the dilution in the cells stimulated by PMA/ionomycin, while expression was consistent across all dilutions tested on PHA/IL-2-stimulated cells. (c) A viSNE plot was generated after pooling all samples from the stromal marker and tumor cell marker titration experiments, and the different samples were color coded. The results demonstrate a distinct separation of ovarian cancer cell lines (Caov-3 and OV-90) from the other samples, while the two dissociated tumor samples (HGSOC#19 and HGSOC#30) and the stem cells (CD34+ cells) show overlapping phenotypes, as well as some cellular similarity with the healthy donor sample (donor PBMCs). (d) Illustration of the gating strategy of the concatenated .fcs files to visualize immune staining. Plots display the sample-wise staining pattern in six samples (in the columns) of four selected markers, two tumor (EpCAM and CD34) and two stromal (PDGFRß and αSMA) antibodies (horizontally) in a dilution series from 1:100 to 1:1600 (vertically). (e) The viSNE plot in (c) color coded according to the specific antibody expression of four antibodies (horizontally) in the combined samples according to titration levels (vertically), from the most diluted on the top to the least diluted on the bottom.

