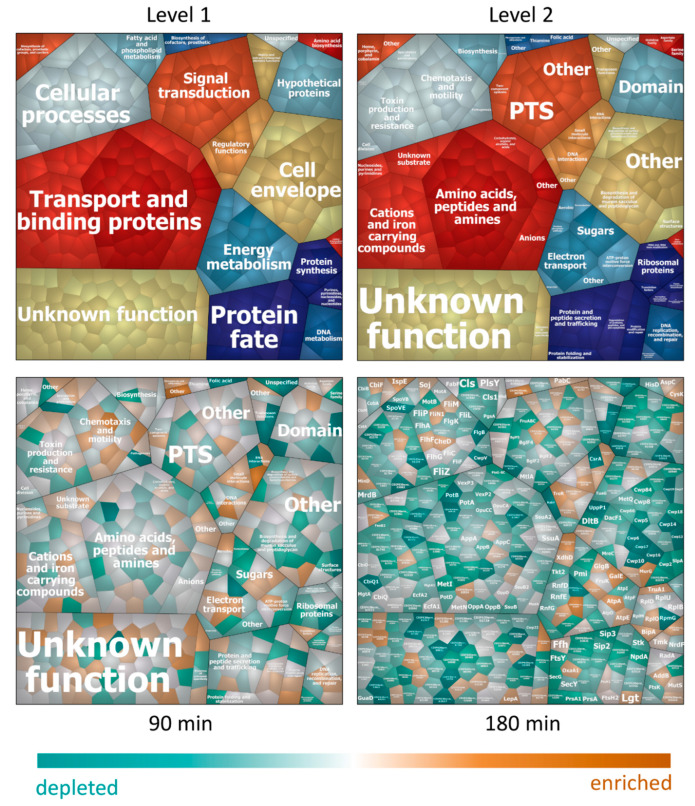
Figure 4.
Voronoi Treemaps for proteins in the membrane fraction. Proteins predicted to be located in the cell membrane, the cell wall or with unknown localisation, which were quantified in the membrane fraction of all samples, are depicted in tiles and were hierarchically clustered according to TIGRFams. The upper part of the figure displays the first two cluster levels of assigned functions. The third level displaying protein names for every single tile is shown in the map for timepoint 180 min. A list of assigned functional groups to all proteins detected in the membrane fraction can be found in Supplemental Material (Supplemental Table S2). The lower part of the figures displays the relative protein abundance at 90 min (left) and 180 min (right) after nisin treatment compared to untreated control conditions, respectively. Tiles of proteins with higher abundance after nisin treatment are colored in shades of orange, tiles of proteins with lower abundance after treatment are colored in turquoise.

