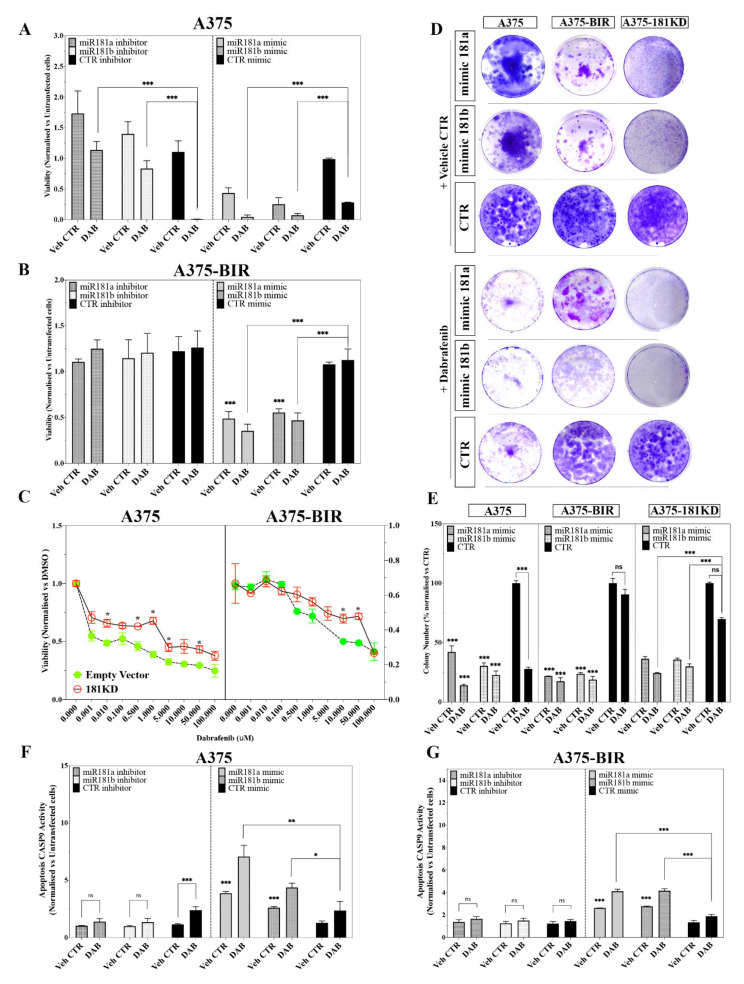
Figure 3.
(A,B) A375 (A) and A375-BIR (B) cells transiently transfected with 40 nM of the miR-181a and -181b mimic or inhibitor or the appropriate controls were treated with 200 nM dabrafenib and assayed for proliferation by the MTT assay. Data are expressed in terms of percentage of cell viability as compared to untransfected cells. Each value represents the arithmetic mean of three independent experiments performed with triplicate samples. *** p < 0.001; * p < 0.01. (C) Effect of miR-181a/b knockdown on cell proliferation in A375 and A375-BIR melanoma cells treated with increasing doses of dabrafenib. Dose-response curves of cell viability according to the sensitivity to dabrafenib is showed for cells knockdown for pre-miR-181a/b (181KD) cluster and controls bearing empty vector (EV, pcDNA3.1-GFP). Data are represented as mean +/− SD, n = 3. (D,E) Colony formation assays were performed to determine the colony formation ability of A375, A375-BIR and A375-181KD cells transfected with miR-181a and -181b mimics or the appropriate controls. Representative images and quantification of visible colonies have been presented. The colony number in the DMSO group was set as 100%. All the experiments were performed in triplicate and the relative colony formation rates are shown as the mean +/− SD. *** p < 0.001; **** p < 0.0001; ns, not significative. (F,G) Effect of forced expression or inhibition of miRNA-181a and -181b on CASP-9 activation in A375, A375-BIR and A375-181KD cells. The determination of CASP-9 activity was carried out by using Caspase-Glo® 9 assay. Data are expressed in fold change relative to vehicle control +/− SD of three independent assays with 3 replicates each one. *** p < 0.001; ** p = 0.001 and * p < 0.01 versus vehicle control; ns, not significant.

