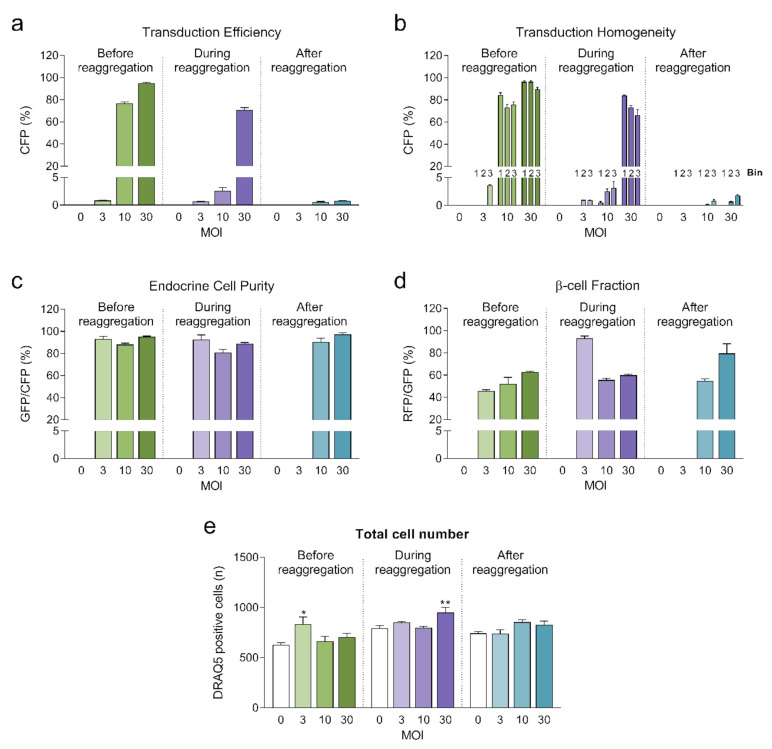
Figure 3.
(a) Transduction efficiency calculated as the percentage of cells expressing Cerulean Fluorescent Protein (CFP) (n = 5–6). Statistical analysis was performed with one-way ANOVA of each transduction method separately. Dunnett’s multiple comparisons tests against the untransduced control of each condition are shown: * p < 0.05, ** p < 0.01; (b) Homogeneity of transduction shown as the transduction efficiency in 3 predefined regions: bin 1 represents the core, bin 2 represents the middle region and bin 3 represents the periphery; (c) Endocrine cell purity calculated as the percentage of CFP positive cells expressing enhanced green fluorescent protein (EGFP). (d) β-cell fraction calculated as the percentage of EGFP positive cells expressing DsRed2. (e) Total number of cells analyzed represented as DRAQ5 positive nuclei count. Outliers were detected with ROUT’s test (Q = 5%).

