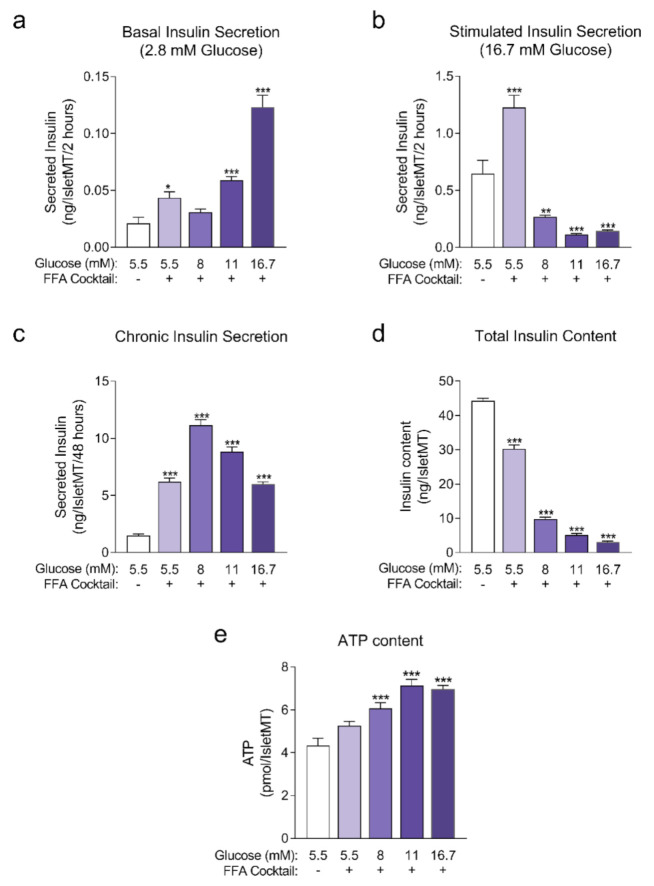
Figure A1.
(a) Basal insulin secretion at 2.8 mM glucose at the end of 14 days of incubation (n = 6); (b) Stimulated insulin secretion at 16.7 mM glucose at the end of 14 days of incubation (n = 6); (c) Chronic insulin secretion to the culture media corresponding to the last 48 h of incubation (n = 12); (d) Intracellular insulin content of islet microtissues after 14 days of incubation (n = 6). (e) Intracellular ATP content of islet microtissues (n = 5–6). Outliers were detected with ROUT’s test (Q = 5%). Statistical analysis was performed with one-way ANOVA. Dunnett’s multiple comparisons tests against the 5.5 mM glucose (without FFA) control of each condition are shown: *** p < 0.001, ** p < 0.01, * p < 0.5.

