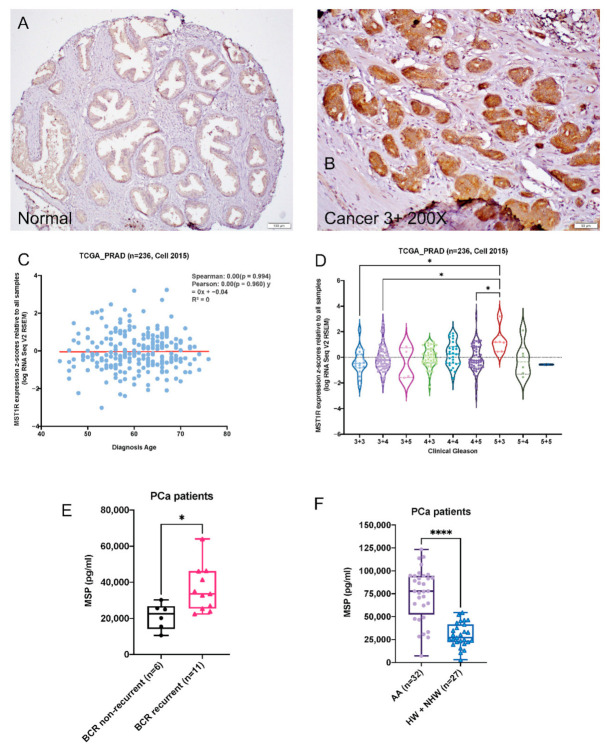
Figure 1.
Alterations of RON in human prostate cancer cells and tumors. (A,B). Expression changes of RON in normal and human prostate tumors. (C). Scatter plot with regression straight line showing the correlation of MST1R mRNA expression in primary prostate tumor tissues and patients’ age in TCGA_PRAD dataset (n = 236) [27] determined by Spearman and Pearson correlation analysis. (D). Violin plot showing expression of MST1R in primary prostate tumor tissues categorized by Gleason status (TCGA_PRAD, n = 236) [27]. Each dot represents a single tumor tissue. Kruskal–Wallis Test was used for statistical analysis, * p < 0.05. Kruskal–Wallis Test was used for statistical analysis, * p < 0.05, **** p < 0.001. (E–F) Box plot shows MSP levels in sera of PCa patients with BCR (n = 11) and without BCR (n = 6; E) and AAs (n = 32), HWs and NHWs (n = 27; F). Statistical significance of the data was determined by Mann–Whitney test.

