Figure 3.
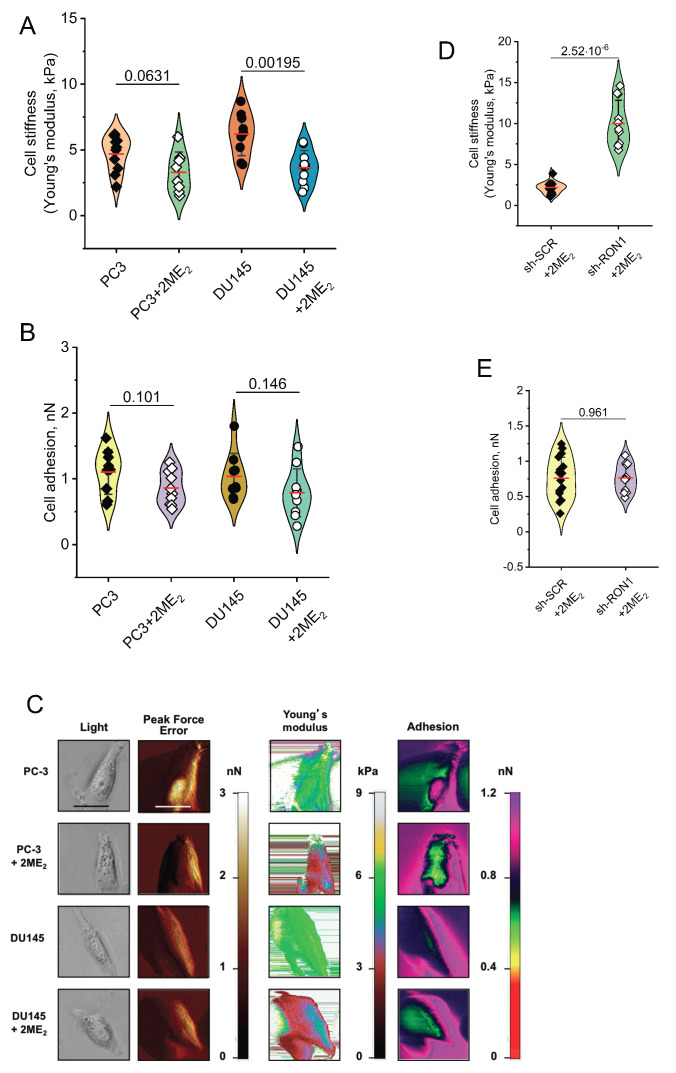
2-ME2 affects cell elasticity and adhesion of PCa cells (A–E). PC-3 and DU145 cells treated with 2-ME2 for 6 h at 3 μM. Increased stiffness of treated cells is reflected by a decrease of Young’s modulus (A). Treated cells are more adhesive (B). Each point represents an individual cell from repeated experiments. kPa = kiloPascals; pN = picoNewtons. (C) A panel of images obtained with the Peak Force QNM AFM shows distinct nanomechanical properties of individual PC-3 and DU145 control or 2-ME2-treated cells. Each row displays four different properties of a single cell with or without 2-ME2 treatment. Each column shows individual property of the cell collected in four channels: light microscopy image, peak force error (edge detection and fine topographical details), cell elasticity (Young’s modulus, kPa) and cell adhesion (nN). Peak Force Error images were used to determine the cell boundary collected in elasticity and adhesion channels. All images (except light microscopy) are false colored. The Peak Force Error scale shows smaller to taller objects progressing from dark brown to white color. The Young’s modulus (elasticity) scale shows softer objects as black and brown (lower modulus) and more rigid as green and yellow (higher modulus). The adhesion scale shows less adhesive objects as yellow and green (less force needed to separate an AFM tip from a cell) and stickier objects as dark blue and pink (more force needed). The black and white scale bars represent 40 and 20 μm, respectively (D,E). Mechanical properties of PC-3 cells stably silenced for RON in the presence and absence of 2-ME2 at 3 μM (6 h). Decreased stiffness is reflected by an increase of Young’s modulus (D). Adhesion of cells does not respond to silencing for RON and 2-ME2-treatement (E). Each point represents an individual cell.

