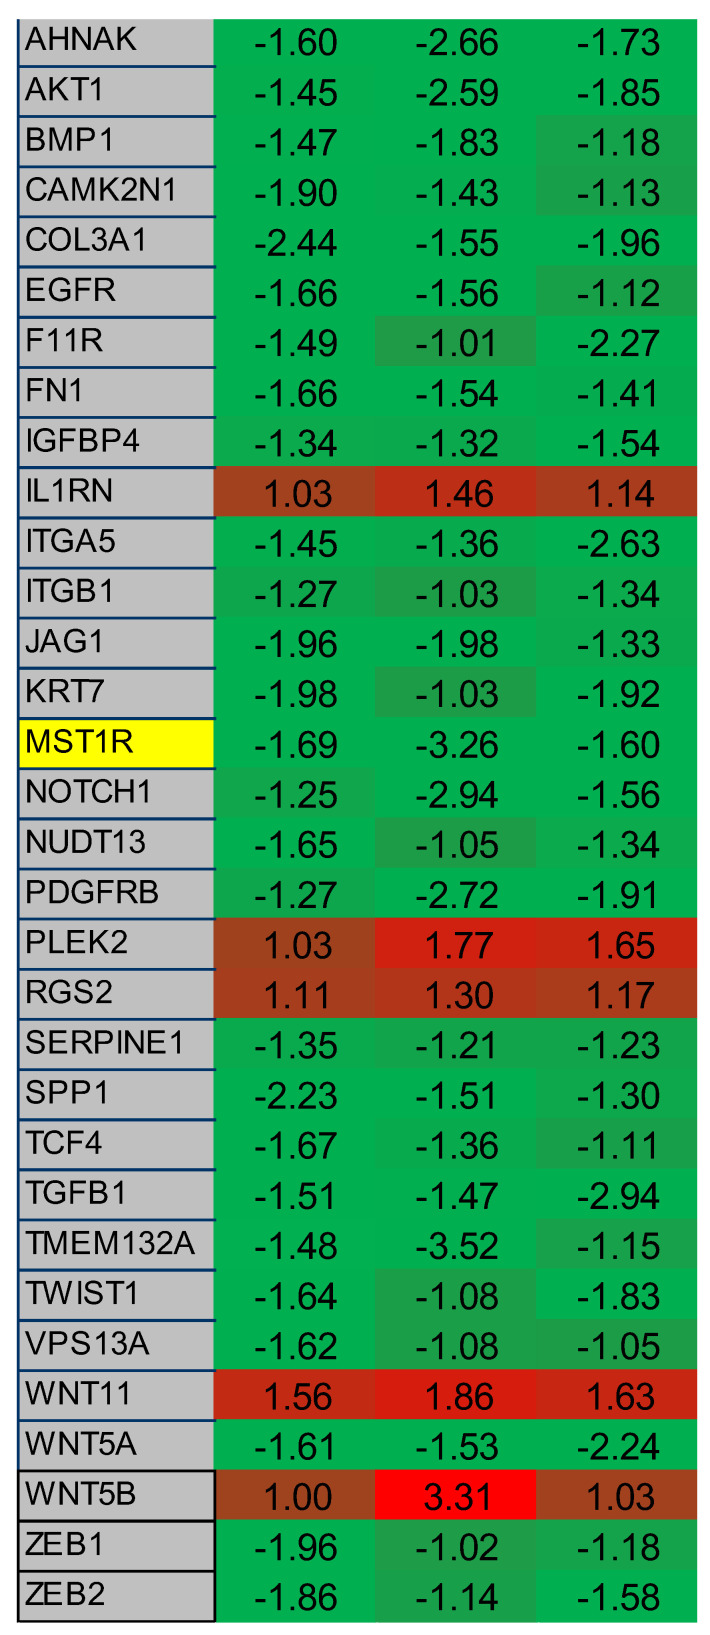
Figure 4.
2-ME2 treatment in PC-3 cells affects multiple genes associated with EMT. A 96-well qPCR array of genes associated with EMT was screened using cDNA derived from control or 24 h 2-ME2 treated (3 µM) PC-3 cells. Each column represents a single experiment. Table shows fold change in gene expression relative to β-actin with consistent results across three experiments. RON (listed as MST1R) is highlighted in yellow. A heatmap was created based on relative overexpression (red) and under expression (green). Green indicates upregulated gene expression from 0 to +4 and red indicates downregulated gene expression from 0 to −4.

