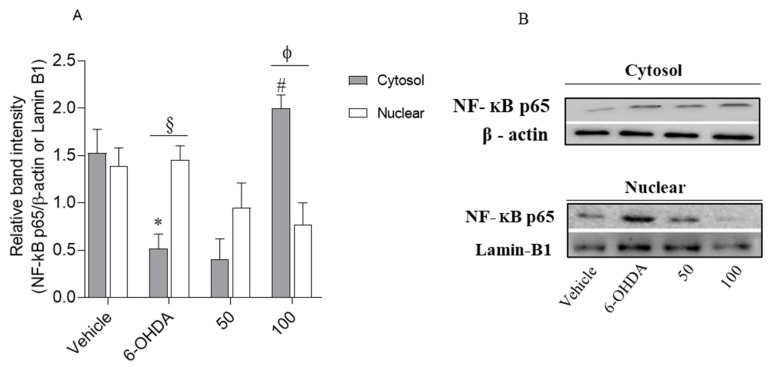
Figure 6.
Comparison of the NF-kB p65 expression levels in the cytosol and nucleus in response to 6-OHDA (100 µM), in the absence and presence of Loliolide (50–100 µM). (A) The values in each column represent the mean ± standard error of the mean (SEM) of 3 or 4 independent experiments. Symbols represent significant differences (ANOVA, Dunnett’s test, p < 0.05) when compared to: * vehicle, and # 6-OHDA, § situation of nucleus and ϕ situation of 50 µM. (B) Relative protein expression levels based on Western-blot band intensity; protein levels were normalized with β-actin and Lamin-B1 in the cytosol and nucleus, respectively.

