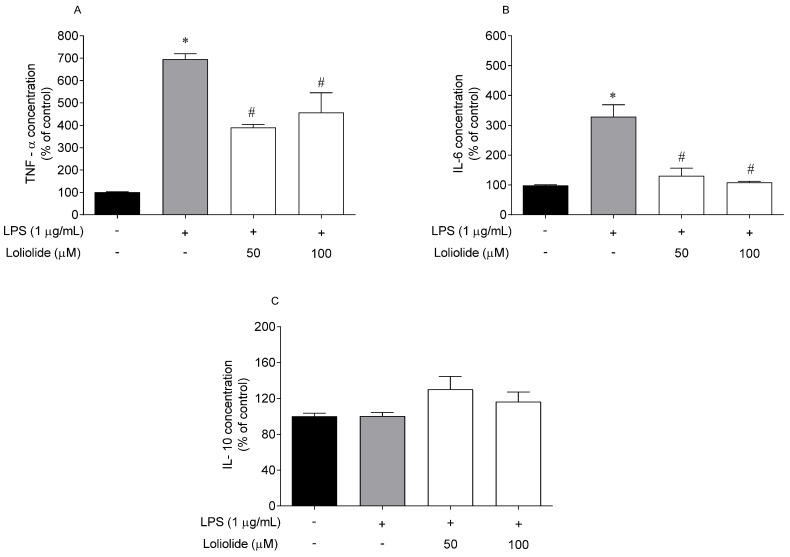
Figure 8.
Levels of pro-inflammatory cytokines on RAW 264.7 cells after exposure to Loliolide (50–100 µM) and to LPS (1 µg/mL) for 18 h. (A) TNF-α; (B) IL-6; (C) IL-10. (+) with LPS and (−) without LPS. The values in each column represent the mean ± standard error of the mean (SEM) of 3 or 4 independent experiments. Symbols represent significant differences (ANOVA, Dunnett’s test, p < 0.05) when compared to: * vehicle and # LPS.

