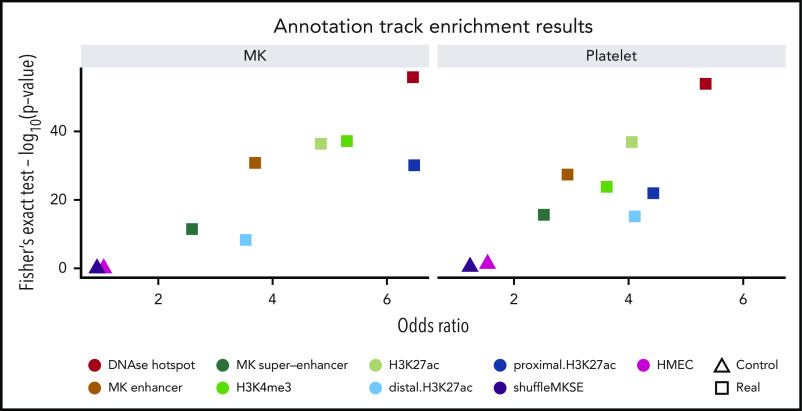
Figure 4.
Enrichment of overlap of eigenMT eQTLs and relevant annotation tracks. Scatter plots show odds ratios (x-axis) vs -log10 (P value) from Fisher’s exact test assessing the overlap of significant eQTLs from our eigenMT analysis with the indicated annotation tracks, including 2 control tracks of no biological relevance to MKs or platelets. HMEC, human mammary epithelial cells.

