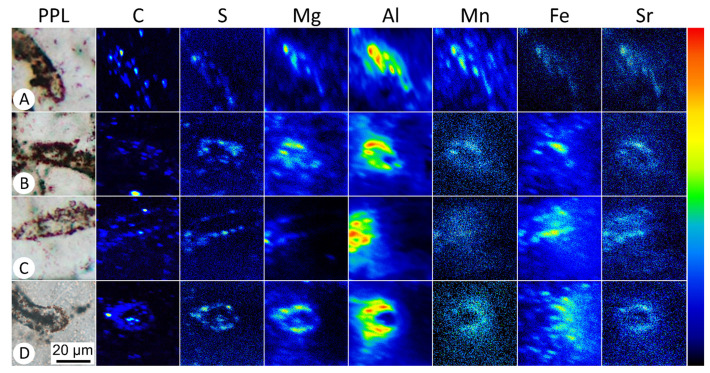
Figure 2.
SIMS mapping of select Drummond microfossils. The first column (A–D) shows plane-polarized light (PPL) images of microfossils targeted for SIMS analyses, with subsequent rows showing the elemental map for the noted element. See Supplementary Materials for complete SIMS image data and quantified concentrations of each sample. The color bar on the right shows relative values from low (black) to high (red). Scale bar in panel D applies to all panels. Note that increased elemental concentrations relative to background are indicated only where the fossil intersects the plane of the top of the thin section, as SIMS is a surface-analysis technique.

