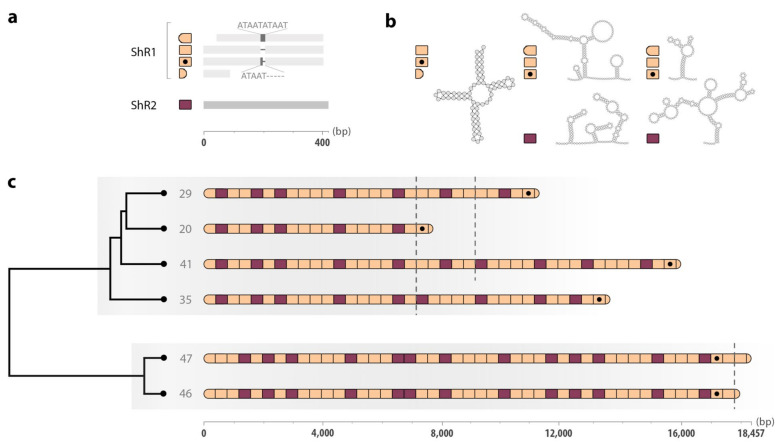
Figure 3.
Structure of the tandem-repeat regions in the mitochondrial (mt) genomes of Schistosoma haematobium. (a) A schematic representation of the units ShR1 (orange) and ShR2 (purple). Insertions of 5′-ATAAT-3′ motifs within a TA-rich region in ShR1s are indicated. Scale in base pairs is shown at the bottom. (b) Secondary structures predicted for ShR1 and ShR2 (units in which they occur are indicated on the left of the structure). (c) A schematic representation of the hierarchical cluster analysis of repeat unit patterns (cf. Figure S3). Orange and purple shapes correspond to units ShR1 and ShR2 in panels (a) and (b). Grey numbers at branch tips correspond to the number of units. Lineage 1 (top) and 2 (bottom) are shaded in grey. Dashed lines demarcate the end of common repeat unit patterns within lineages. Scale in base pairs is shown at the bottom.

