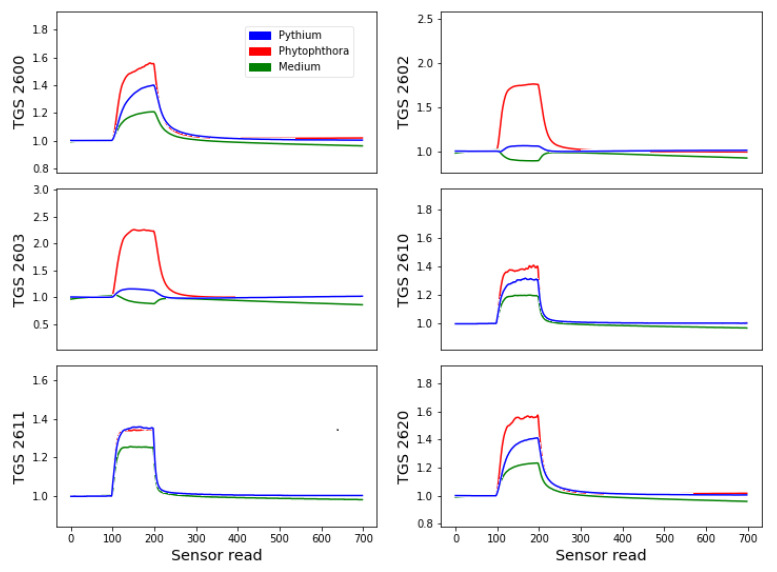
Figure 3.
Examples of sensor response versus time of measurement (number of reading during measurement) for each sensor in the sensor array. Separate curves for three studied sample types are presented. Y-axis represents the sensors’ responses normalized by the baseline value, calculated as , where G is the measured conductance, and is the average of the conductance measured in the clean air. On the X-axis, the numbers of sensor reads are shown, which happens every 1.22 s.

