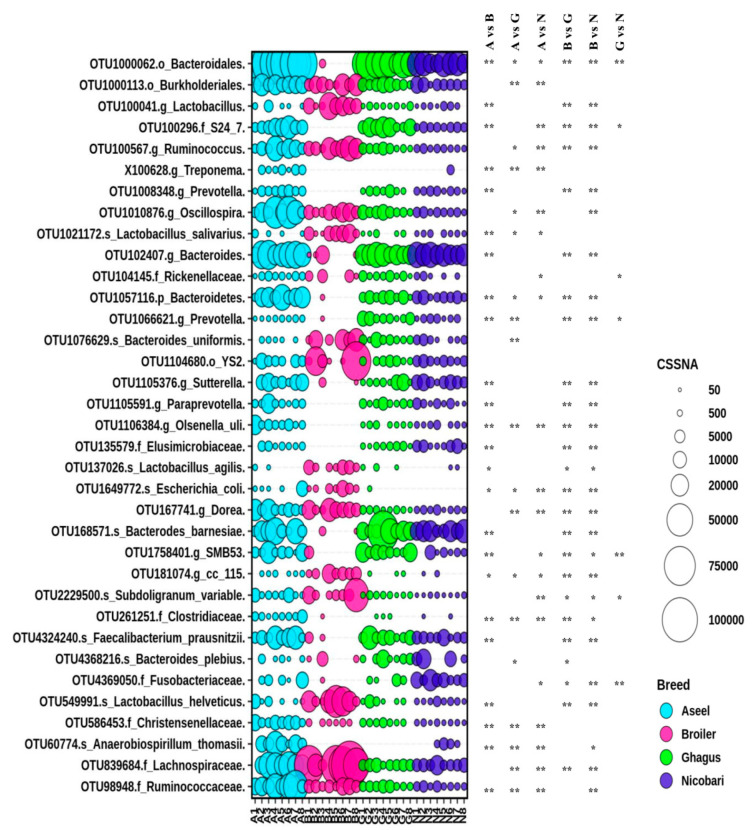
Figure 4.
Differential abundance of gut microbiota in different breeds or lines at OTU level. Top 35 abundant phylotype-OTUs, out of 88 phylotype-OTUs with a significant difference in relative abundance among groups identified with edgeR, were plotted. The size of bubbles in the bubble plot indicates the normalized (cumulative sum scaling) abundance of each OTU. * p-value < 0.05; ** p-value < 0.01.

