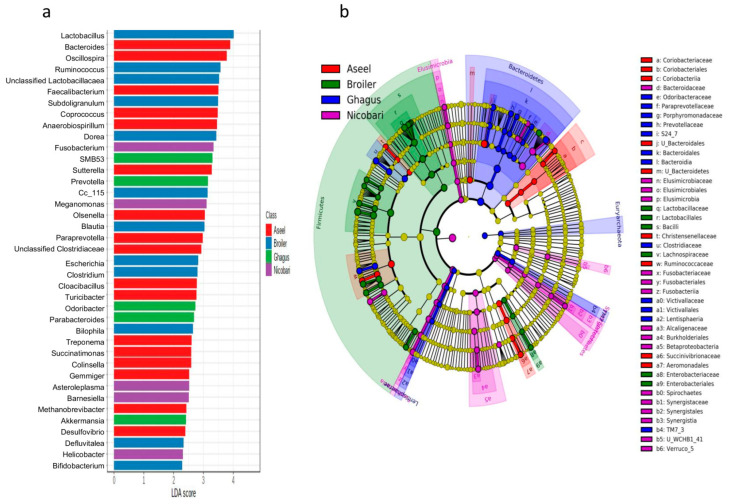
Figure 6.
Chicken breed or line-specific biomarkers. (a) Genus level biomarkers identified using linear discriminant analysis effect size (LEfSe) analysis using the Kruskal–Wallis test (p < 0.05) with linear discriminant analysis (LDA) score >2.0. (b) Cladogram representation of differentially abundant microbiota at the different taxonomic levels. The taxonomic levels of the phylum are labeled, while the order to the genus is abbreviated (only labels of top 43 clades are shown here), with the colors indicating breed/line with the highest abundance. The cladogram has been dual rooted to denote domain archaea and bacteria.

