
FIGURE 1.
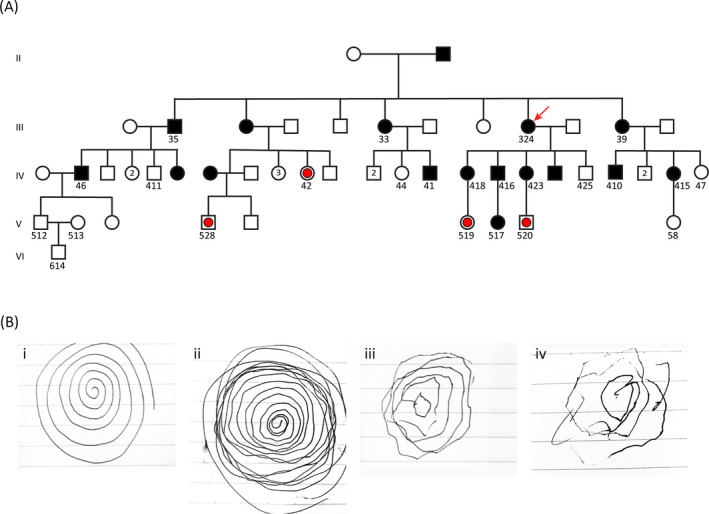
FCMTE pedigree and spiral drawing to show the range of tremor severity. A, Partial pedigree of the family showing the part we studied from generations II to VI. The proband (324) is marked by a red arrow. All individuals whose DNA was tested are identified by a number written underneath the male or female symbol. The filled symbols indicate clinically affected individuals; open symbols indicate clinically normal individuals, and open symbols with red dots indicate individuals who were clinically normal at the time of evaluation but carried the mutant allele as detected by repeat‐primed PCR data. B, Tremor as shown through the spiral drawing task. The examiner first drew a spiral to illustrate the task (i). The remaining drawings demonstrate the range of increasing severity of the tremor in three family members from mild (ii, 416 in panel A), moderate (iii, 418 in panel A), and to severe (iv, 324 in panel A)