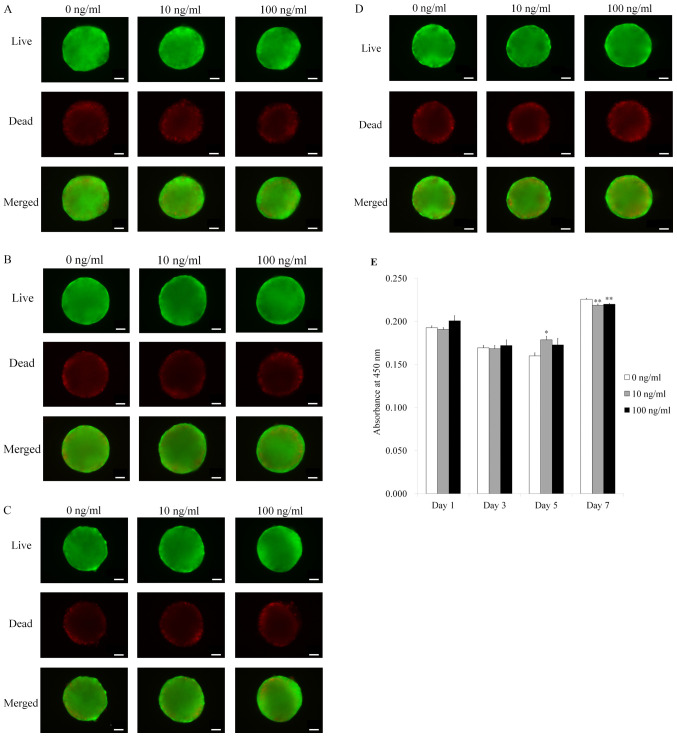
Figure 3.
Live, dead and merged images of stem cell spheroids. (A) Live, dead and merged images of stem cell spheroids on day 1. Scale bar, 100 µm. (B) Live, dead and merged images of stem cell spheroids on day 3. Scale bar, 100 µm. (C) Live, dead and merged images of stem cell spheroids on day 5. Scale bar, 100 µm. (D) Live, dead and merged images of stem cell spheroids on day 7. Scale bar, 100 µm. (E) Cellular viability was assessed using a Cell Counting Kit-8 assay on days 1, 3, 5 and 7. *P<0.05 vs. IGF-2 at 0 ng/ml on day 5; **P<0.05 vs. IGF-2 at 0 ng/ml on day 7. IGF-2, insulin-like growth factor 2.

