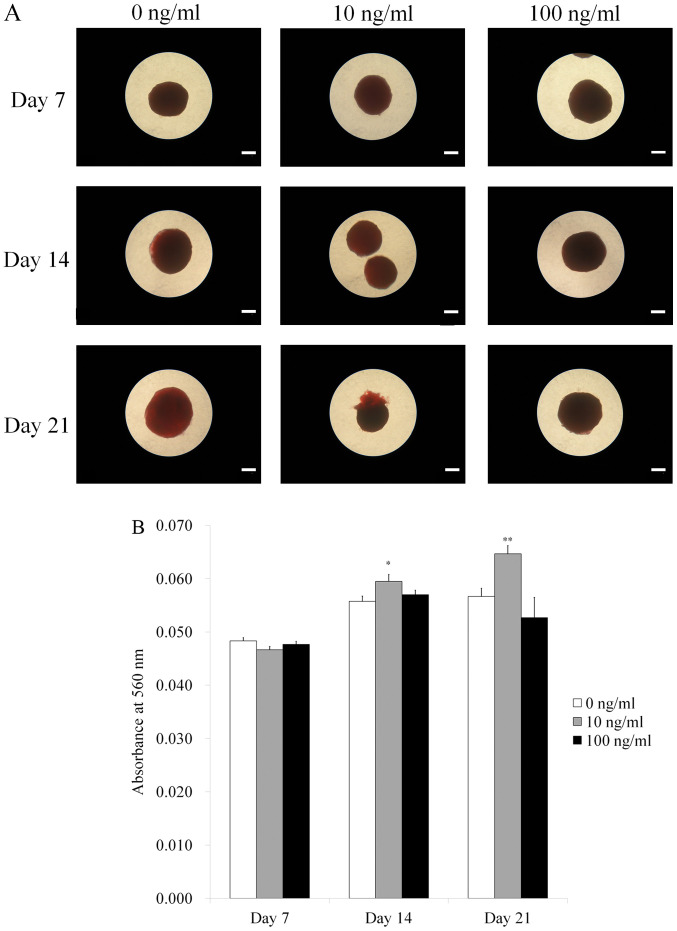
Figure 5.
Results of Alizarin Red S staining on days 7, 14 and 21. (A) Microscopic evaluation. Scale bar, 200 µm. (B) Quantitative analysis of Alizarin Red S staining. *P<0.05 vs. IGF-2 at 0 ng/ml on day 14; **P<0.05 vs. IGF-2 at 10 ng/ml on day 14; #P<0.05 vs. IGF-2 at 0 ng/ml on day 21; ##P<0.05 vs. IGF-2 at 10 ng/ml on day 21. IGF-2, insulin-like growth factor 2.

