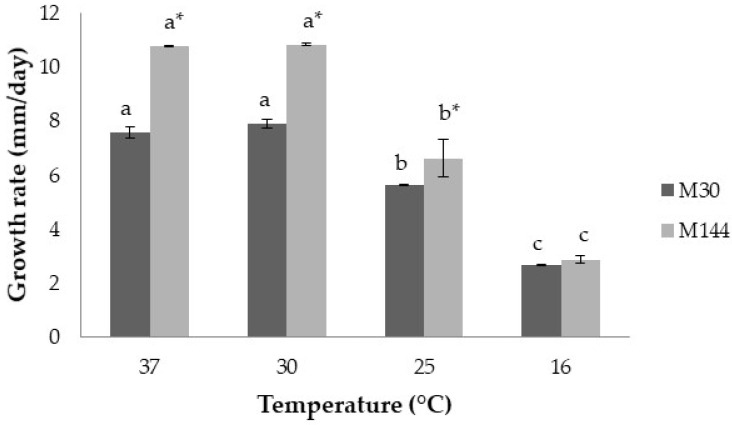
Figure 5.
Growth rate (mm/day) of the Aspergillus flavus M144 and A. flavus M30 at the different temperatures studied over the 12 days incubation period. Different letters indicate significant differences at the different temperatures for the same strain (p ≤ 0.05). Asterisk (*) means significant differences between both strains at the same temperature (p ≤ 0.05).

