Figure 2.

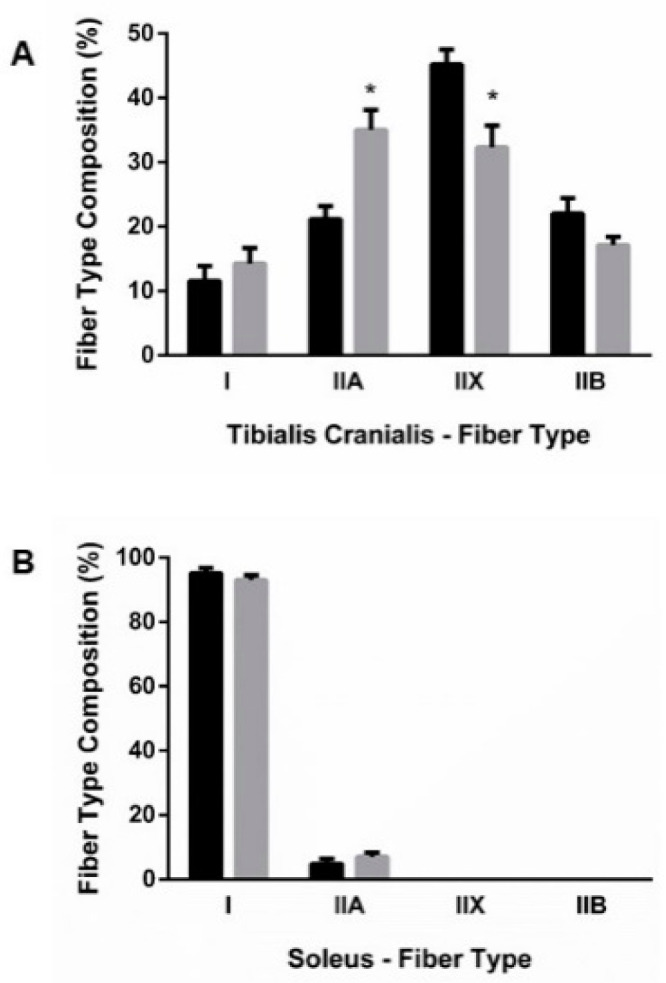
Fiber-type composition of (A) tibialis cranialis (TC) and (B) soleus (SOL) muscles. Student’s t-test between control (black bars) and energy-restricted (grey bars) groups. * p < 0.05 vs. control.

Fiber-type composition of (A) tibialis cranialis (TC) and (B) soleus (SOL) muscles. Student’s t-test between control (black bars) and energy-restricted (grey bars) groups. * p < 0.05 vs. control.