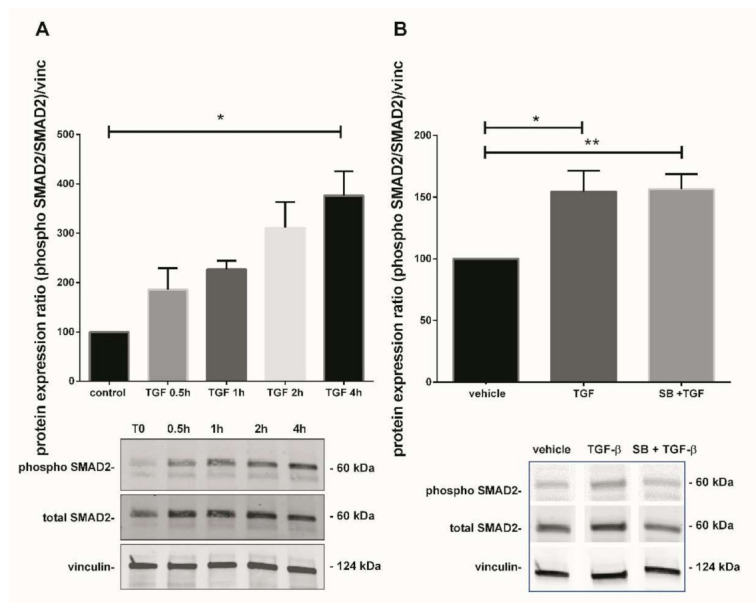
Figure 4.

Effect of TGF-β1 on SMAD2 activation. (A) Kinetic of SMAD2 phosphorylation in 7–9 GW chorionic villi exposed to TGF-β1 at different times. The results are expressed as the phosphorylated SMAD2/total SMAD2 ratio and normalized on vinculin expression. Data are expressed as percentage of the control (T0) and represented as median +/− interquartile, n = 3 different placentas. * p < 0.05, Friedman test was applied; (B) Phosphorylation of SMAD2 protein in chorionic villi exposed to TGF-β1 for 48 h or SB203580 during 1 h prior to TGF-β1 treatment. Results are expressed as the phosphorylated SMAD2/total SMAD2 ratio and normalized on vinculin expression. Data are expressed as percentage of vehicle and represented as mean +/− SEM, n = 7 different placentas. * p < 0.05, ** p < 0.01, RM one-way ANOVA was applied. Control refers to untreated chorionic villi and vehicle refers to DMSO treatment.
