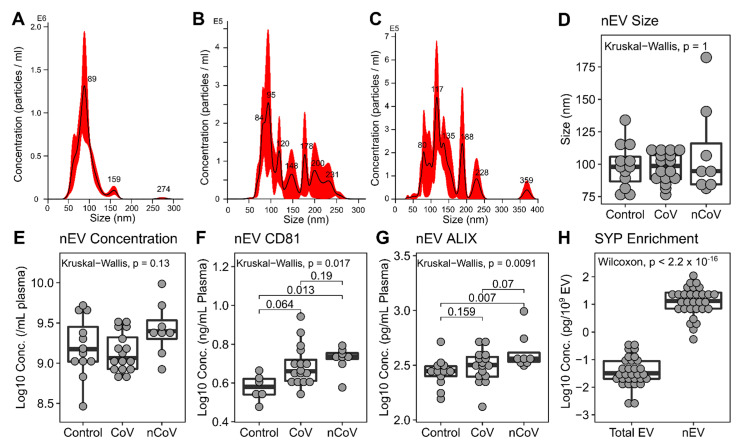
Figure 2.
nEV characterization. Representative NTA spectra from Control (A), CoV (B), and nCoV (C) showing the heterogeneous nature of the nEVs from COVID-19 participants. Variance of sizes were significantly different among the groups, Levene test p < 0.0001. nEV sizes determined by NTA (D) for Control (n = 12), CoV (n = 16), and nCoV (n = 8) showed no difference between the groups. nEV concentrations were determined by NTA (E) (n is the same as panel D). nEV protein cargo for CD81 (F), ALIX (G), and SYP (H) were determined using ELISA. CD81 showed an increase in nCoV (n = 8) compared to Control (n = 6). ALIX increased in nCoV (n = 8) compared to Control (n = 12) but not significantly to CoV (n = 16). (H) Synaptophysin (SYP) is enriched in nEV (n = 30) compared to total EVs (all EVs in plasma, n = 30). Kruskal–Wallis test was used and followed with post hoc Dunn tests if significant for groupwise differences.

