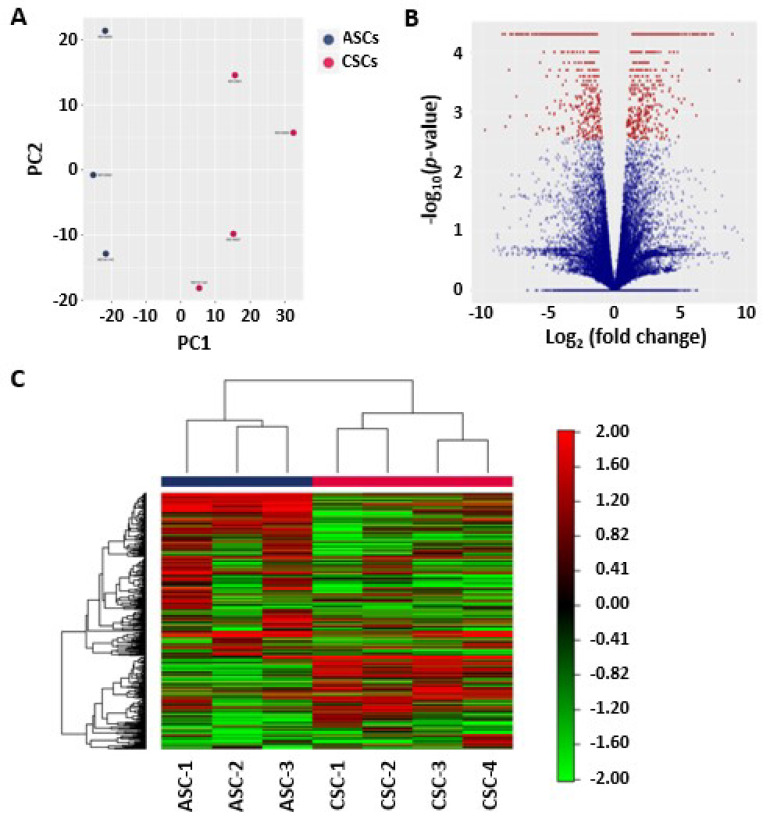
Figure 2.
Differential expression patterns between ASCs and CSCs. (A) Principal component analysis (PCA) plot for ASCs and CSCs. The PCA was performed on all samples that passed the quality control using the 500 genes that had the largest coefficients of variation based on the fragments per kilobase of transcript per million mapped fragments (FPKM) counts. Each circle represents a sample. (B) Volcano plot showing the relationship between the raw p-values and the log2-fold change in normalized expression (FPKM) between ASCs and CSCs. (C) Heat map and unsupervised hierarchical clustering by sample and gene were performed on the listed samples using the 500 genes that had the largest coefficients of variation based on the FPKM counts. The data are based on samples from the ASC and CSC groups.

