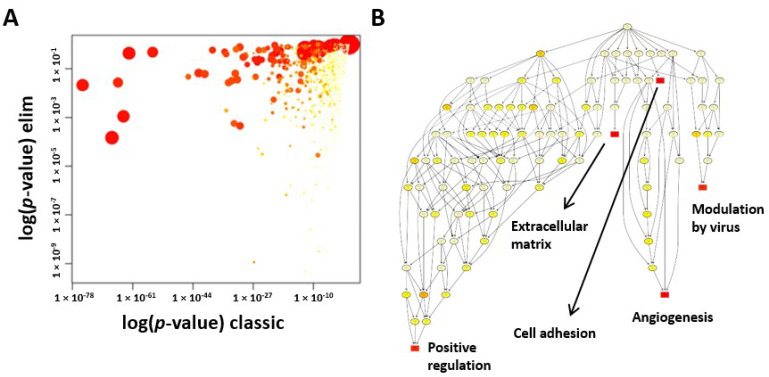
Figure 3.
Gene Ontology (GO) analysis of ASCs and CSCs. (A) Scatter plot of the significantly enriched GO terms associated with genes that were differentially expressed between the ASCs and CSCs. The plot shows a comparison of the results obtained by the two statistical tests used. Values along diagonal were consistent between both methods. Values in the bottom left of the plot correspond to the terms with the most reliable estimates from both methods. The size of a dot is proportional to the number of genes mapping to that GO term, and the color represents the number of significantly differentially expressed transcripts corresponding to that term, with dark red representing more terms and yellow representing fewer. (B) The GO network generated for the enriched GO terms (biological process) associated with genes that were differentially expressed between the ASCs and CSCs. The nodes are colored from red to yellow, with the node with the strongest support colored red and nodes with no significant enrichments colored yellow. The five nodes with the strongest support are marked with rectangular nodes.

